
A look at the role key trends in customer experience, product innovation, and business growth have in shaping the sports betting and iGaming industry’s future.
A look at the role key trends in customer experience, product innovation, and business growth have in shaping the sports betting and iGaming industry’s future.
Lovelytics has secured strategic investments from Databricks Ventures and Interlock Equity. Having two industry-leading partners supporting our team, our mission, and the vision of Lovelytics helps us accelerate the growth of our amazing team and culture.
Whether you look at hard dollars alone or add other factors, the Databricks lakehouse remains the most strategic investment.
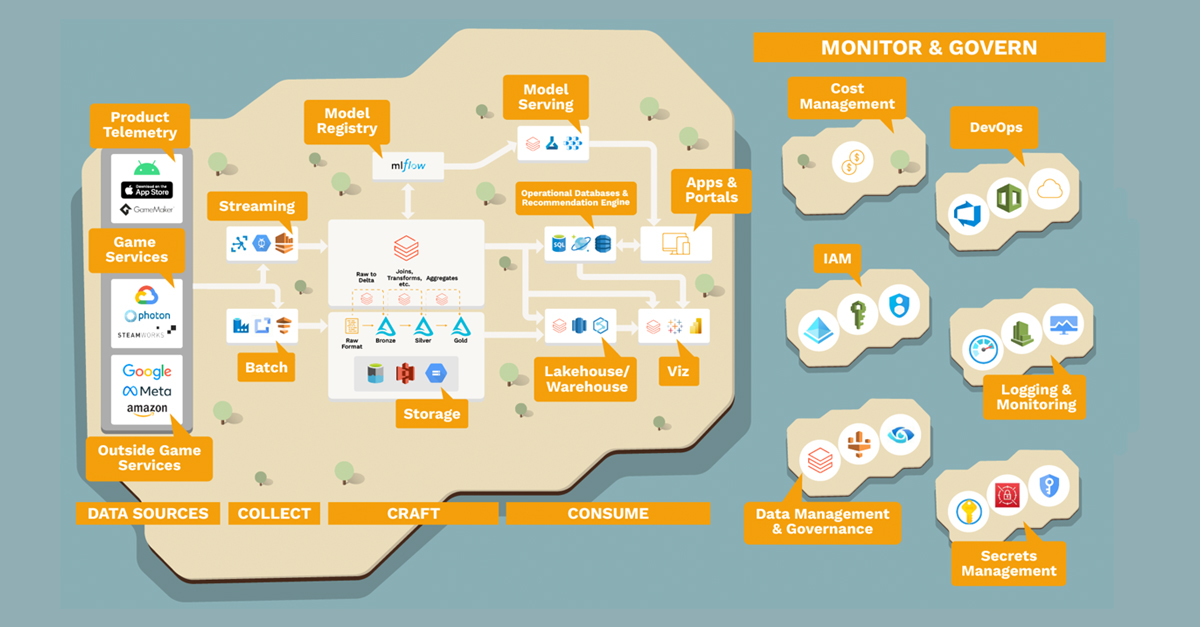
Quickly stand up a 360-degree view of your game using Lovelytics’ game analytics Brickbuilder Solution
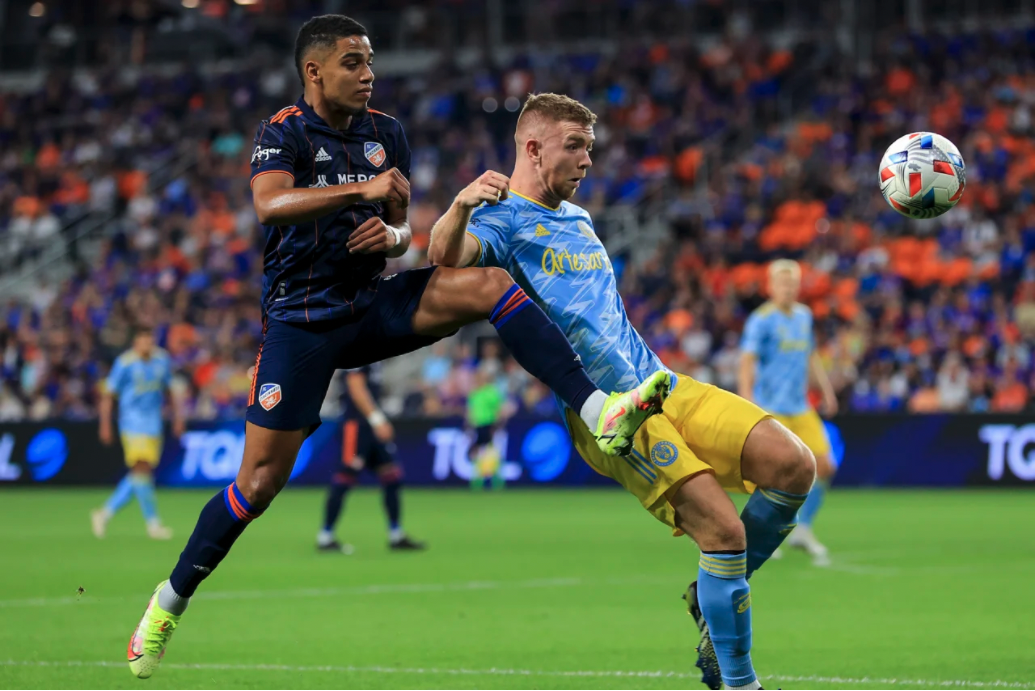
Photo Courtesy of Philadelphia Union Innovations In Analysis Innovations and advancements in technology have provided a way to gather real-time precise data points during any sporting event. The result is better insights into hundreds if not thousands of variables that might give a team a strategic advantage on the field and in the team’s back office as … Read more
The View from the Lakehouse Blog Series PART 2 Over the past few years, the term “data lakehouse” has grown in popularity. Why? Fundamentally, a data lakehouse combines the best of data warehouses and data lakes, supporting business intelligence and advanced analytics workloads in a single platform. In other words, a data lakehouse provides a … Read more
The View from the Lakehouse Blog Series PART 1 Recently, Lovelytics held our first in-person all-hands meeting in more than a year. We gathered at our headquarters in Arlington, VA to socialize, strategize, and evaluate past decisions. A major theme this year (and in years past) was the changing needs of our clients, and how … Read more

Most of us are inevitably going to be asked one of the most common questions this time of year: “What are you thankful for?” Of course, I am grateful for my husband, my maniac of a dog, my family, and the food I’m fortunate enough to have on the table every day. But let’s be … Read more
Synopsis: This article is a 101 level introduction to Databricks SQL, and will walk you through the steps to build simple visualizations directly within a Lakehouse environment. The article is focused around the UI and workflow of DBSQL and assumes the reader has basic SQL knowledge. Databricks SQL (DBSQL) forms one of the three main … Read more

Utilizing Set Actions in a Tableau dashboard can enhance the user experience and overall value of the dashboard. New insights on the data can be made by having a Set Action that provides an easy way of altering a Set in a dashboard to compare the values of a dimension against a selected measure. Set … Read more

This is Blog #1 in a 3 Part Blog Series On HL7 and Healthcare Data Interoperability What is HL7? If you’ve worked with healthcare data, chances are you’ve heard of HL7v2. To give some background for those who aren’t familiar, HL7v2 is a messaging standard that is used to electronically exchange clinical data between systems … Read more

This is Blog#2 In A 3-Part Series on HL7 and Healthcare Data Interoperability In Blog #1 of the series, we showed you how to get set up with Smolder and start parsing your HL7 data. Now we’re going to show you how to start processing that data while building out a simple Medallion Architecture. For … Read more

This is Blog #3 in a 3 Part Blog Series On HL7 and Healthcare Data Interoperability In the past 2 blog posts (Click here to access Blog #1 and Blog #2) of this series, we’ve shown you how to use Smolder to parse your hl7v2 data and build a Medallion architecture within Databricks. Let’s look … Read more

Let’s face it – most of us got our analytical starts in Excel. We were asked to create complex functions or automate manual data entry and suddenly we were hooked. We pride ourselves on our ability to stretch the limits of Excel, making it do things it was never meant to do. But what happens … Read more
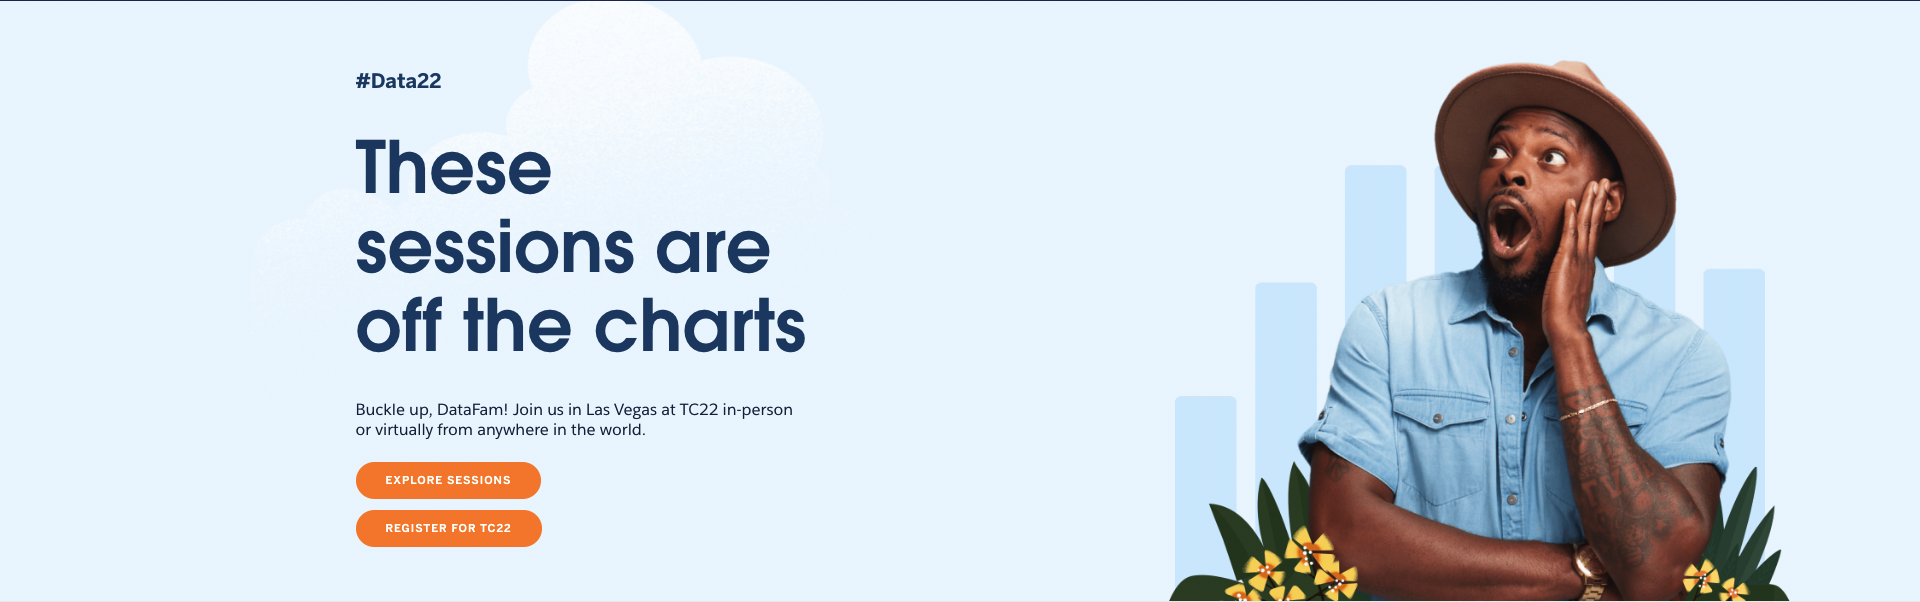
Lovelytics, a Gold Sponsor at this year’s Tableau Conference 2022 , is being well represented by our best and finest data visualization consultants. With a Tableau Visionary (formerly Zen Master), Tableau Ambassadors and frequent contributors to enable and support the overall Tableau Community, we are excited and proud to have Chantilly Jaggernauth, Agata Ketterick, Sekou … Read more