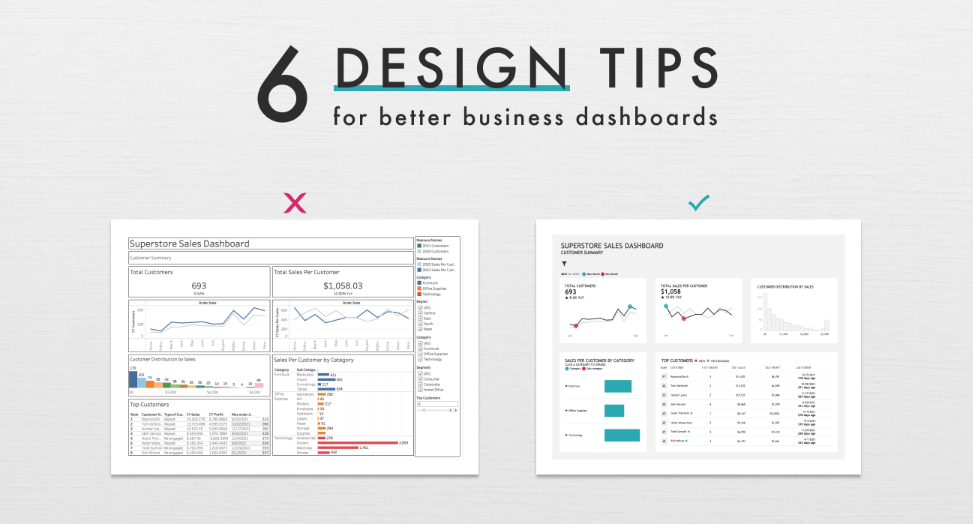
I’ve always found web scraping interesting, there’s a massive trove of data available to us in a wide array of formats- it presents the perfect ‘big data’ problem, how can we capture, ingest, analyze, and leverage this data? To keep things relevant for a broader audience, I’m going to focus on the capture and ingest … Read more

Have you ever added a formula tool to your Alteryx workflow and suddenly realized that your IF/THEN logic is starting to look more like a book and less like a logical function? Or maybe you really miss the ability to simply reference a prior row’s result within an Excel function? In either scenario, you might … Read more

The phrase coined by Henrick Ibsen “A picture is worth a thousand words”, is a great reminder of the power of data visualizations in telling a story with data.  To effectively use data to tell a story we need to make sure our dashboards support, not hinder our storytelling. This series will cover six (6) … Read more

Has your organization recently deployed Tableau Mobile or is planning to deploy soon? Not sure how to optimize all your existing Tableau dashboards for mobile devices? Then keep reading for tips and tricks on making your desktop dashboards mobile-friendly! You may be thinking, “Wait, I thought Tableau automatically created dashboards that would look great on … Read more

We use data and analytics every day to answer those “W” questions: Who purchased our new product? Which carrier has the best on-time delivery record? What customer segment drove our change in sales? But how often are you faced with a “Where” question and you’re unable to find a quick and easy answer? Say you … Read more

This is Blog #3 in a 3 Part Blog Series On HL7 and Healthcare Data Interoperability In the past 2 blog posts (Click here to access Blog #1 and Blog #2) of this series, we’ve shown you how to use Smolder to parse your hl7v2 data and build a Medallion architecture within Databricks.  Let’s look … Read more