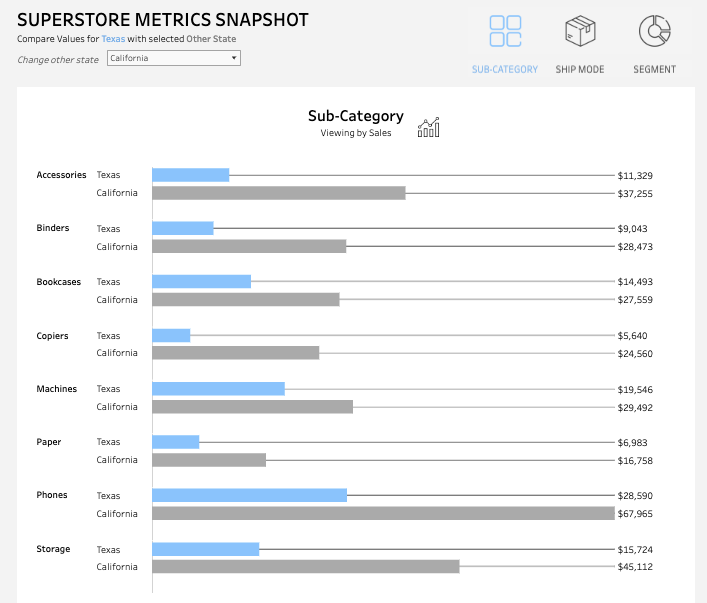
There are a variety of scenarios in which we may want to compare one singlevalue of a categorical field in our data set against another value from thatsame field. In its simplest form, this can be achieved by applying a filter based on thedimension that only shows the two desired values. This works when we … Read more
Data visualization
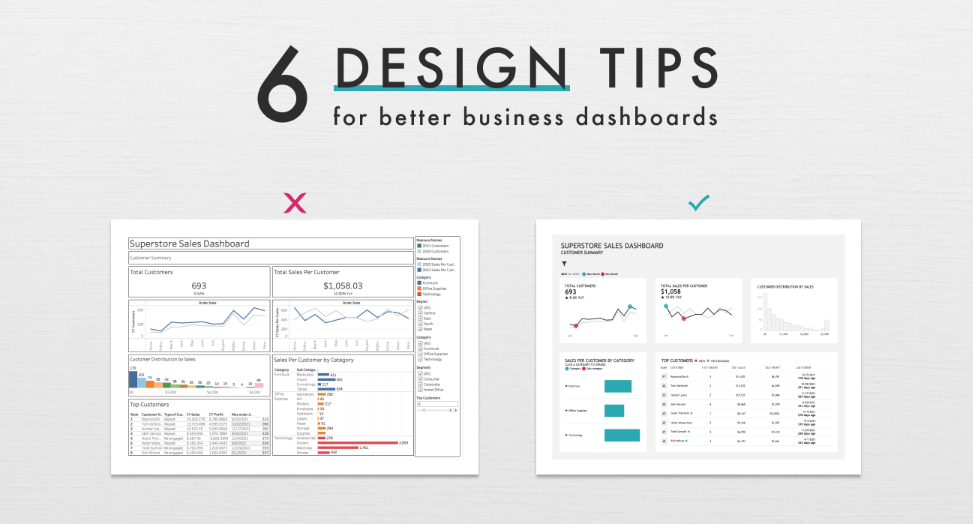
The phrase coined by Henrick Ibsen “A picture is worth a thousand words”, is a great reminder of the power of data visualizations in telling a story with data. To effectively use data to tell a story we need to make sure our dashboards support, not hinder our storytelling. This series will cover six (6) … Read more
Has your organization recently deployed Tableau Mobile or is planning to deploy soon? Not sure how to optimize all your existing Tableau dashboards for mobile devices? Then keep reading for tips and tricks on making your desktop dashboards mobile-friendly! You may be thinking, “Wait, I thought Tableau automatically created dashboards that would look great on … Read more
We use data and analytics every day to answer those “W” questions: Who purchased our new product? Which carrier has the best on-time delivery record? What customer segment drove our change in sales? But how often are you faced with a “Where” question and you’re unable to find a quick and easy answer? Say you … Read more
Lovelytics, a Gold Sponsor at this year’s Tableau Conference 2022 , is being well represented by our best and finest data visualization consultants. With a Tableau Visionary (formerly Zen Master), Tableau Ambassadors and frequent contributors to enable and support the overall Tableau Community, we are excited and proud to have Chantilly Jaggernauth, Agata Ketterick, Sekou … Read more
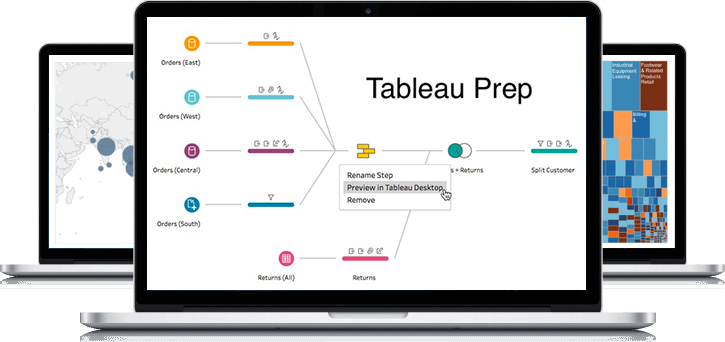
One feature of tableau prep is the ability to help with data cleansing. Data cleansing is the process of detecting and correcting (or removing) corrupt or inaccurate records from a dataset, table, or database and refers to identifying incomplete, incorrect, inaccurate, or irrelevant parts of the data and then replacing, modifying, or deleting the dirty … Read more
When working in Tableau, I find there are instances where we might want to color a text table based on a dimensional field, or maybe more specifically, a type of KPI. For example, lets say we have the table view below of Sales by Sub-category and Segment, and we want to color the numbers based … Read more


