How to compare a Static Dimensional Value to a Dynamic Value of the same Dimension-Part 1
There are a variety of scenarios in which we may want to compare one single
value of a categorical field in our data set against another value from that
same field.
In its simplest form, this can be achieved by applying a filter based on the
dimension that only shows the two desired values. This works when we will
always want just these two values, but what if we want our end users to be
able to dynamically change the second value?
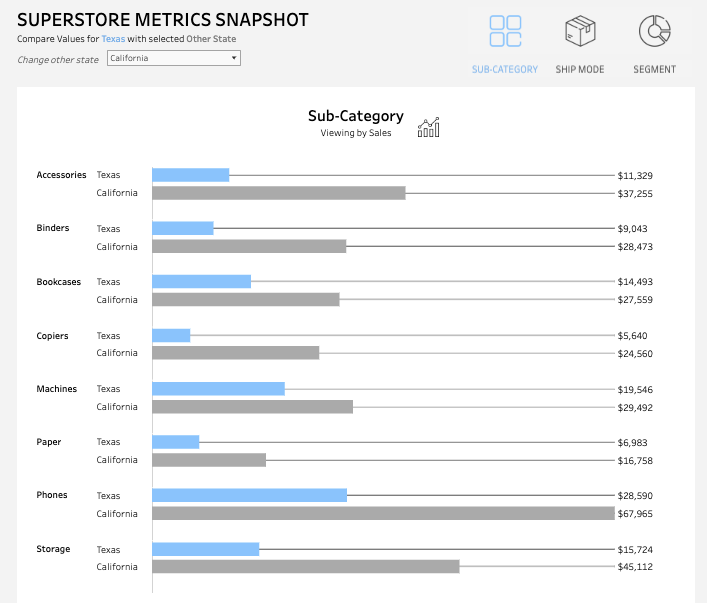
In this case, I’m interested in comparing how Texas is performing against
one other selected state.
You can download the workbook here.
As aforementioned, I could leverage a filter with a multiple value list,
multiple value dropdown, or multiple value custom list format if I was okay
with the end user being able to select any of the states—but I don’t want end
users to be able to deselect Texas or to select more than one comparison
state.
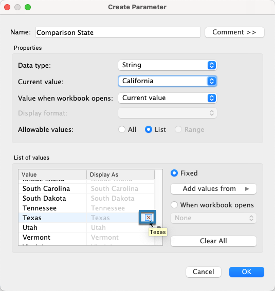
Step 1: Create a parameter and show the parameter control.
Name: Comparison State
Data Type: String
Current Value: (Select whichever value you want populated by default)
Allowable Values: List
Add Values from: Your dimension (State in this example)
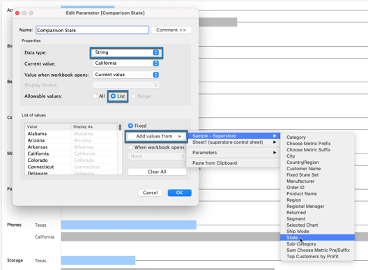
IMPORTANT NOTE: When you create your parameter after you “Add values from” make sure to exclude the static value you are wanting to compare against. In this example, I am deleting Texas by clicking the small, red X next to it.
Step 2: Create a calculated field to tie the parameter to your data set
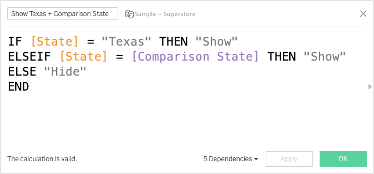
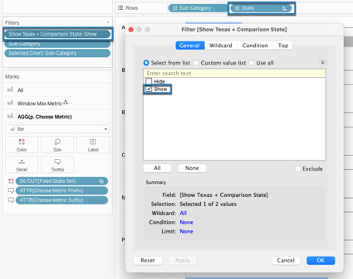
Step 3: Add the calculated field as a filter
Set the filter to “Show”. Make sure the dimension you’re wanting to see (in this case State) is being used on the Rows shelf
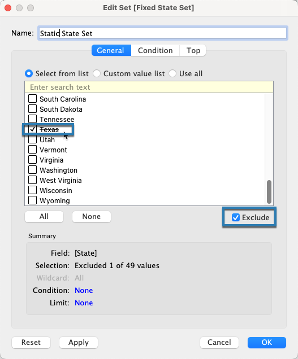
Step 4: To change the colors systematically, so that the dynamic dimensional value is always one color, create a set from the dimension field
Right click State in the data pane > Create > Set
Name: Static State Set
Select the static value, then choose “Exclude” and click OK
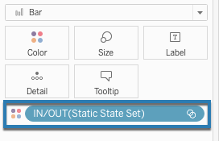
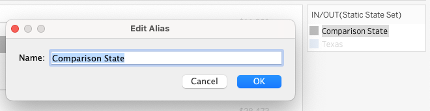
Bring the Static State Set to Color, then edit the colors so that “Out” (the static value that we excluded) is your primary color and “In” is a more neutral color. You can rename In/Out in the view by right-clicking each in the color legend and choosing “Edit Alias”.
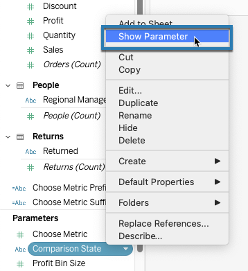
Step 5: Right-click on the parameter in the data pane and choose to Show Parameter
At this point we have solved the problem of being able to dynamically compare any single selected dimensional value against a static, pre-selected value of the same dimension.
Read the 2nd Blog in this series here to see the additional formatting and functionality added to allow the end user to analyze the static and variable dimensional values against additional measures and dimensions that they select.
We work with clients every day, helping them do more with their data. How can we help you? Please visit us at www.lovelytics.com or connect with us by email at [email protected].