
Utilizing Set Actions in a Tableau dashboard can enhance the user experience and overall value of the dashboard. New insights on the data can be made by having a Set Action that provides an easy way of altering a Set in a dashboard to compare the values of a dimension against a selected measure. Set Actions are also helpful when creating interactive maps.
Using a Set Action to drill down by category:
Below, I show how to create an example “Change Set Values” action on a simple Tableau dashboard using the Sample-Superstore dataset. The overall purpose of the following Set Action is to create a visualization that shows how much each Product category contributes to overall Sales.
To create a Set Action on a dashboard, we first need a Set and a dashboard that uses the Set in a visualization.
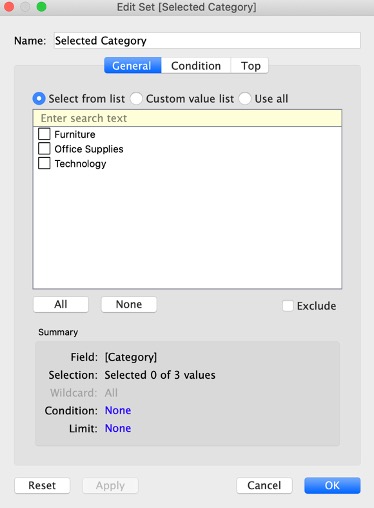
Once connected to the Sample-Superstore dataset in Tableau, a Set can be created for the Product category field. To do this, simply right click the Category pill and hover over “Create” from the menu options, then select “Set”. This set can be left empty for now; the Set Action that is created later will add and remove values from the Set.
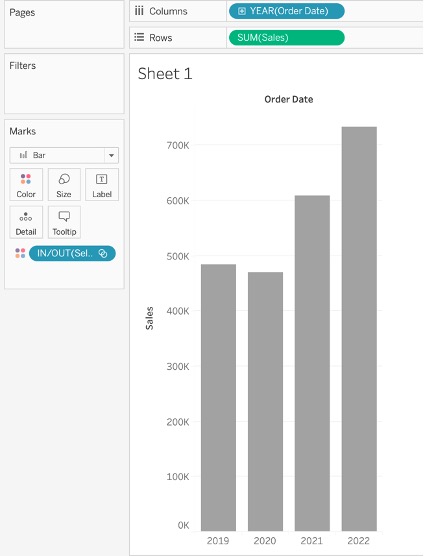
Next, we will need to create a visualization that will change based upon the values that are selected to be in the Set. In this case, the visualization can be a bar chart of Sales by Year that show how much the category in the Set is contributing to the Sales. To do this, Click and drag sales to rows and order date in a discrete year format to columns. After that, drag the “Selected Category” set to color.
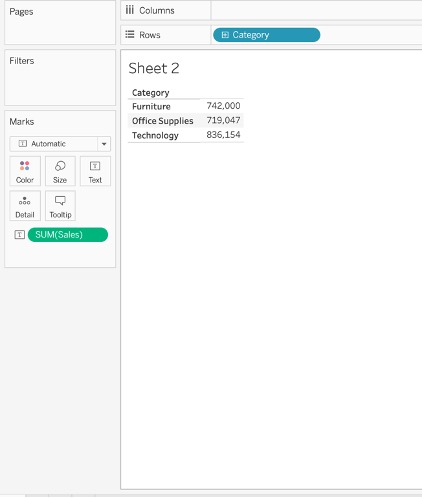
Next, it is time to create the sheet that will be the source for the action. For what is desired, a simple table of the Product categories and their corresponding overall Sales should suffice. This is because, in the dashboard, a Product category can be selected and easily added or removed from the Set using a Set Action. To create this table, click and drag Category to rows and Sales to text on the marks card.
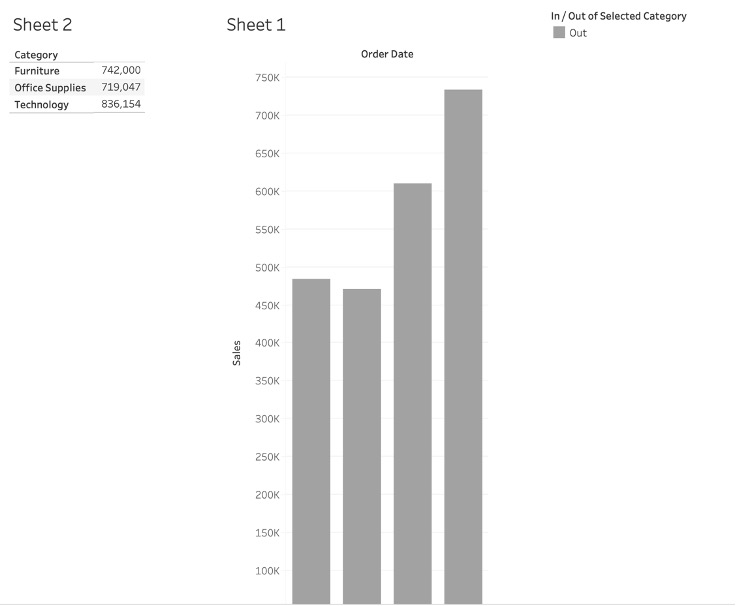
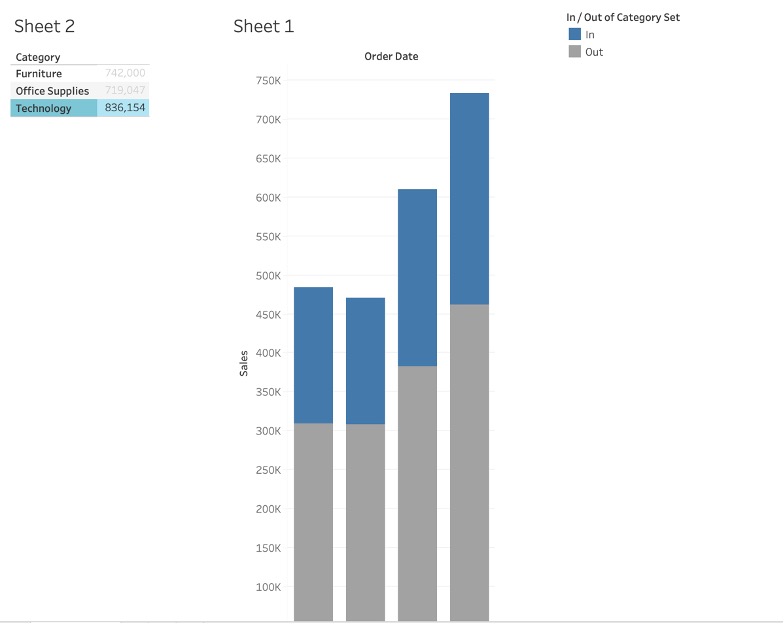
Now that there are two worksheets, we can make a dashboard. After creating a new dashboard and dragging both worksheets to the workspace we can get something like this:
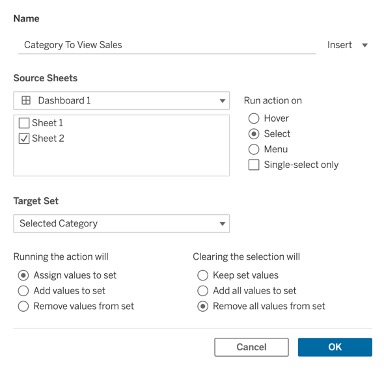
Since there is now a dashboard with a Set in the visualization, a Set Action can be added. Click on “Dashboard” then “Actions” and under “Add Action” click “Change Set Values”. The following image shows how to configure this action so that if a Product category in “Sheet 2” is selected, then the bar graph in “Sheet 1” will change and show how much the selected category contributes to the overall Sales for each Year.
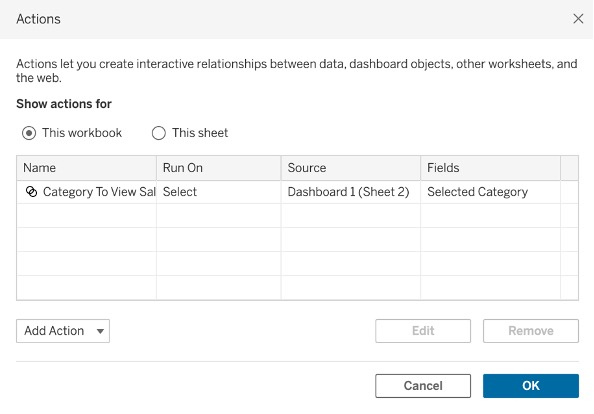
After configuring the dashboard action and clicking “OK”, the Set Action should be shown in the list of actions.
There is now a functioning Set Action on this dashboard. If we are to, for example, click on the category technology under “Sheet 2”, technology will be added to the “Category Set” that was created earlier, and the bar graph under “Sheet 1” will be colored to show how much the technology category contributed to overall Sales each Year. We have successfully created a dashboard that implements a set action in a useful way!
Using Set Actions to drill down from Region to State in a map:
Another handy use case for Set Actions is to drill down in geographical data in a map in Tableau. Below, I show how to use a Set Action to drill down from Region to State in the Sample – Superstore dataset.
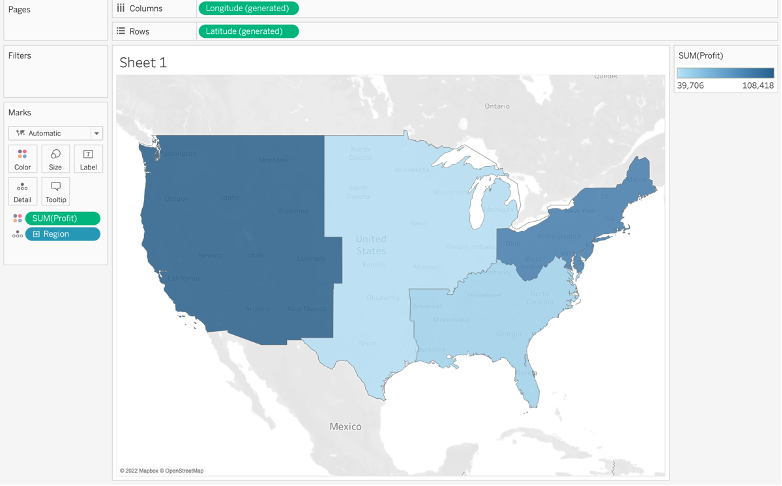
After connecting to the Sample – Superstore dataset, a map displaying Region wise profit can be created by simply dragging Region to the center of the view and then dragging Profit to color on the marks card.
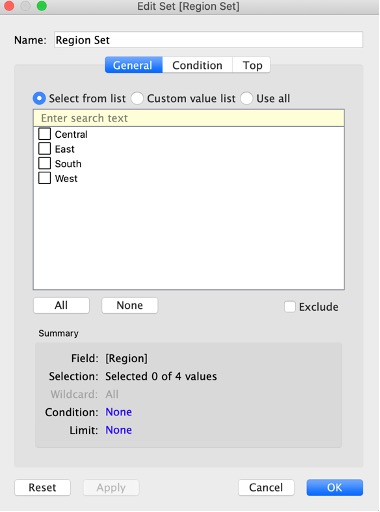
The next step is to create an empty Set on the Region dimension. To do this, right click on the Region pill and from the menu hover over “Create”, then click “Set”.
Now, a calculated field is needed to do a drilldown from the Region level to the State level. This calculated field will use the new Set we just created. Checking what Region is in the Set and then displaying the States for that Region is the desired result. The following calculated field will accomplish this.
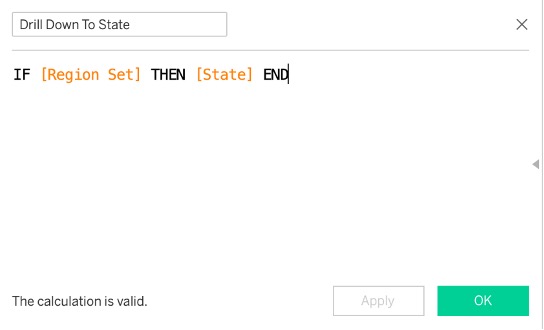
Once this calculated field has been created, it should be dragged to detail on the marks card.
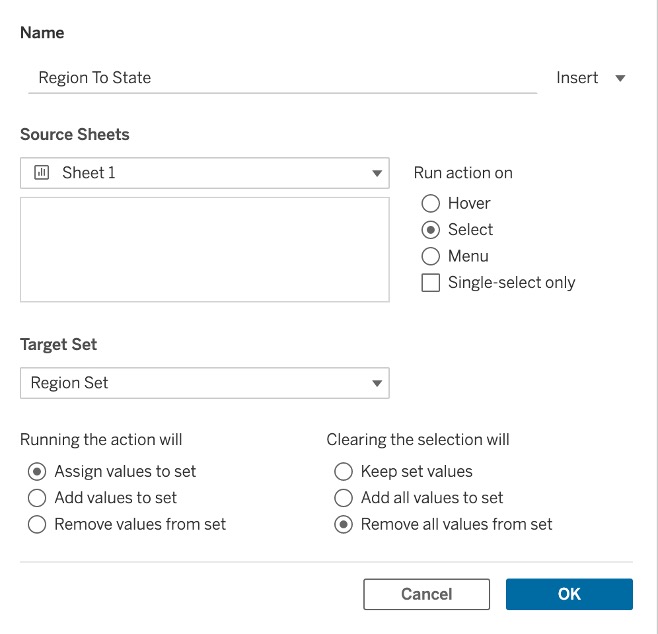
It is finally time to create the Set Action on this worksheet (click “Actions” from the “Worksheet” menu) that will show the drilldown to State level when a Region is selected. The following image shows how the action should be configured for the desired outcome.
Now that the Set Action has been created, if the central Region of the map were to be clicked, the view would look like the following image.
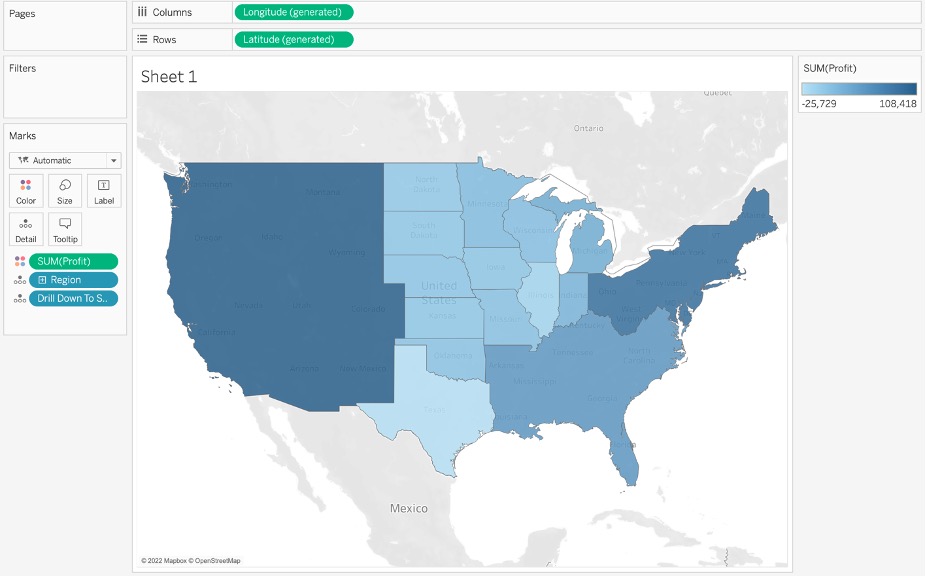
We have successfully shown the drilldown to the State level on this worksheet. A user can now click on a Region to see the States within the selected Region and their overall Profit.
Recap:
In conclusion, you can use Set Actions to increase user interactivity on your dashboards and make analysis more meaningful. This example is a simple one and just scratches the surface on what can be done with Set Actions in Tableau. However, this example still shows the power of Sets. The visualizations in this dashboard are simple to make, yet with the Set and Set Action, more insight is gained into how the Sales of Product categories differ across the years.