Alteryx Tool Tip: The Multi-Row Tool
Have you ever added a formula tool to your Alteryx workflow and suddenly realized that your IF/THEN logic is starting to look more like a book and le...
"*" indicates required fields

June 16, 2025


Have you ever added a formula tool to your Alteryx workflow and suddenly realized that your IF/THEN logic is starting to look more like a book and le...

Synopsis: This article is a 101 level introduction to Databricks SQL, and will walk you through the steps to build simple visualizations directly wit...
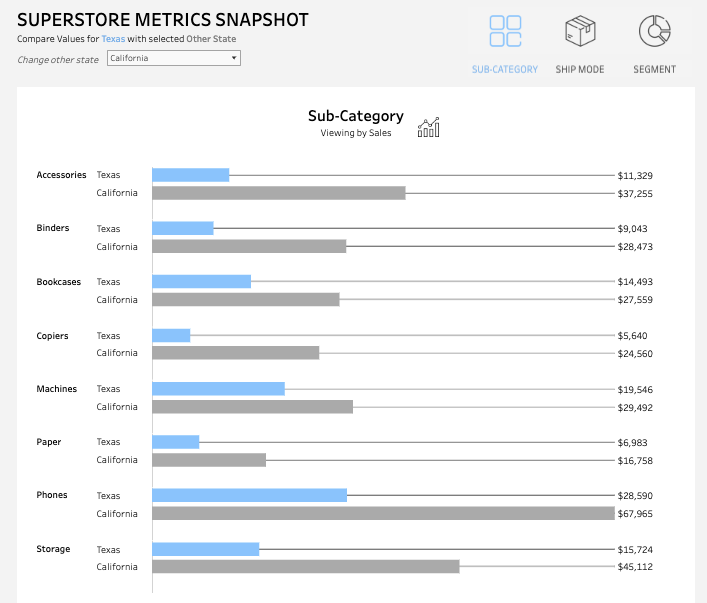
Welcome to Part 2 of the series comparing one “static” dimensional value against another “dynamic” value of the same dimension. In this sect...

There are a variety of scenarios in which we may want to compare one singlevalue of a categorical field in our data set against another value from th...
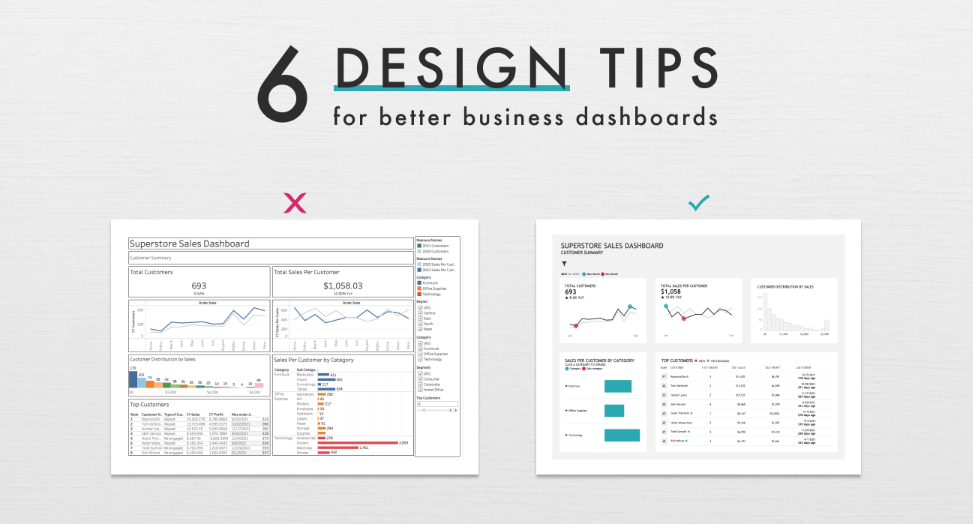
The phrase coined by Henrick Ibsen “A picture is worth a thousand words”, is a great reminder of the power of data visualizations in telling a st...

We use data and analytics every day to answer those “W” questions: Who purchased our new product? Which carrier has the best on-time delivery rec...

Written by: Alyssa Williams We use data and analytics every day to answer those “W” questions: Who purchased our new product? Which carrier ha...

I just returned from the Alteryx Inspire Conference. Whew, what an event. Alteryx Inspire had a heavy emphasis on supporting “Analytics for All�...