Executive Overview
Traditional warranty analytics systems share a fatal flaw- they tell you what broke yesterday, not what will break tomorrow. By the time a warranty claim appears, the failure has already occurred, the customer is dissatisfied, and the cost is locked in.
This article introduces a Unified Intelligence Layer (UIL) that transforms warranty management from reactive firefighting to proactive risk prevention—powered by advanced analytics, machine learning, and orchestrated LLM intelligence on the Databricks Lakehouse Platform.
What is the Unified Intelligence Layer (UIL)?
UIL is an integrated analytical framework that combines advanced quantitative statistical methods, traditional machine learning algorithms, and qualitative LLM intelligence into a cohesive system for early warning and risk detection management. It uses a progressive seven-layer architecture, moving from historical analysis (“what happened”) through pattern discovery and forecasting to actionable recommendations (“what should we do”). The objective is to provide a comprehensive 360° view that enables early issue detection, eliminates process inefficiencies, and minimizes risks and losses while identifying bottlenecks and devising recovery strategies for delays, disruptions, and recurrent failure patterns.
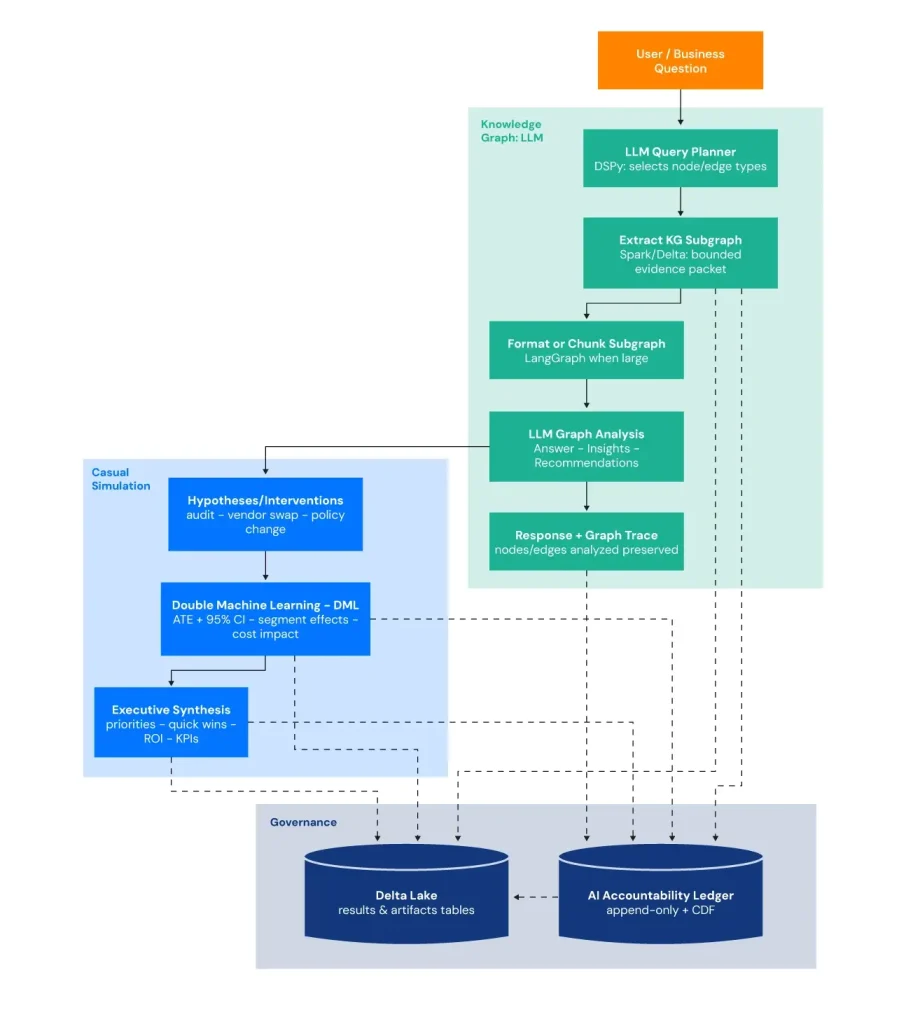
Each analytical layer generates standardized outputs, executive dashboards, statistical metrics, top risk explanations, and technical patterns, which LLMs then synthesize into business-ready narratives. This creates a feedback loop where quantitative rigor meets qualitative interpretation, transforming raw data into strategic action. An integrated data agent enables secure query generation by analyzing tables, applying guardrails to mitigate malicious intent, executing validated SQL queries, generating valuable insights. The platform combines Knowledge Graph + LLM analysis (extracting a bounded, question-relevant subgraph with cost/risk/volume weights and sending it to the LLM with traceability), causal inference via Double Machine Learning (testing “what-if” interventions with ATE, confidence intervals, and segment-level heterogeneous impacts), and an AI Accountability Ledger (persisting recommendations, evidence IDs, lineage, and model/prompt settings in an append-only Delta table with CDF) to ensure outputs are both decision-ready and fully auditable.
Built on the Databricks Lakehouse Platform, the UIL unifies data and intelligence to eliminate silos, enable real-time processing, and run scalable analytics, while MLflow underpins MLOps by tracking experiments, metrics, artifacts, and lineage to govern model promotion and continuously monitor production performance.

Why Traditional Warranty Systems Fail: The Five Critical Blind Spots.
- Pattern Detection Blindness: Siloed systems fragment knowledge, causing repeated problem-solving and missed signals; emerging failure modes and defects can spread before being noticed.
- Trend Detection Gaps: Tools don’t reliably catch gradual degradation, seasonality, sudden shifts, or cycles, so slow-building issues worsen unnoticed until they become hard to triage.
- Timing and Speed Problems: Long detection-to-action delays (weekly/monthly cycles) let issues escalate, and lack of risk scoring makes it hard to prioritize what matters.
- Early Intervention Challenges: Problems are found too late; systems lack forecasting, predictive indicators, and the ability to identify at-risk populations for proactive intervention.
- Analytics Capability Gaps: Missing advanced techniques (e.g., anomaly/change-point detection, time-to-failure, correlation/pattern methods, dynamic thresholds, automated escalation) leaves risk management underpowered.
The Bottom Line: What Are the Blind Spots Costing You?
The financial impact is substantial and measurable: fraud schemes can operate across dealer networks undetected, preventable recalls can escalate into major incidents, and manufacturing defects can spread across production batches before a pattern is detected.
The Five Blind Spots (manufacturing plant, part vendor, dealer, vehicle make/model, part category or subcategory, VIN) cover a large part of what an early-warning and risk detection system needs—especially for quality drift, supplier issues, and localized spikes).
• Network-wide fraud that goes undetected: Coordinated dealer behavior and forensic analysis, inflated labor/parts, and fabricated claims persist when anomaly and pattern detection is limited.
• Claims leakage driven by inefficient, fragmented processing: Siloed workflows and inconsistent controls increase cycle time, cost per claim, and overpayment risk.
• Manufacturing defects that escape early quality detection: Process drift and batch-level issues are not identified quickly, allowing defects to propagate across hundreds (or thousands) of units.
• Recurring failure patterns that create lemon law exposure: Repeat repairs and escalating severity are not flagged early, leading to avoidable buybacks, legal costs, and customer attrition.
• Lack of cross-dealer intelligence to distinguish fraud from quality issues: Without benchmarking and network context, legitimate quality problems can be mistaken for bad actors, while sophisticated fraud can blend and continue as legitimate warranty issues.
What These Blind Spots Are Costing You
• Higher warranty expenses from undetected fraud, leakage, inefficient claim handling
• Preventable recalls and rework as defects spread before containment
• Increased lemon law buybacks and litigation risk from late identification of repeat-failure vehicles
• Dealer relationship damage from misclassification of legitimate concerns versus fraudulent behavior
• Brand reputation erosion when customers experience preventable failures
• Competitive disadvantage from reactive corrective measures while others use predictive intelligence for proactive maintenance
• Constant crisis management consuming executive time and resources
What Does It Take to Close the Gaps?
A shift from fragmented systems to an intelligent platform that applies analysis such as:
• Benford’s Law anomaly detection to flag manipulated or unnatural claim amount patterns
• Sigma or process capability analysis to detect manufacturing drift and emerging defect signals
• Lemon law pattern recognition to identify buyback candidates before escalation
• Cross-dealer and quality analytics can be used to distinguish legitimate quality issues from fraudulent activity and to identify quality concerns, failure patterns, survival analysis, trend analysis, and recurrent issues early—before they spread across the fleet or escalate into costly buybacks, recalls, or dealer disputes.
The Solution: Seven-Layer Intelligence Architecture
The UIL implements a progressive analytical stack moving from “what happened” to “what should we do next,” with each layer generating standardized outputs: delta lake tables with pertinent outputs, statistical metrics, top risk examples, and technical interpretation guides.
Layer 1: Reactive Analytics (What happened?)
This layer establishes performance baselines through executive dashboards that analyze historical data using both OLAP operations (slice-and-dice, roll-up, drill-down, pivot) and segmentation/profiling. It tracks failure rates, costs, frequencies, and concentrations across vehicles, components, manufacturing plants, makes and models, part numbers, suppliers, subcategories, dealers, and time periods. Additionally, it computes multi-level composite risk scoring to reveal emerging reliability and cost anomalies.
Output: Multiple interactive dashboards with top 50-100 items ranked by severity.
LLM: Top critical risk scores are semantically interpreted to analyze Risk Pathway Mapping (part to model to dealer to financial exposure), Counterfactual Root Cause Hypotheses, Time-Bounded Action Plans (7/30/90-day containment and eradication strategies), Next Best Action, Cross-Dashboard Pattern Synthesis (hidden correlation detection), and Machine-Executable Trigger Catalogs—transforming statistical insights into actionable interventions with clear accountability and execution timelines.
Layer 2: Diagnostic Analytics (Why did it happen?)
The layer identifies root causes and predictive signals through comparative analysis, temporal trend detection, correlation analysis, lagged and temporal correlation indicators, co-occurrence patterns with LIFT scores to ensure it is not a random event. This layer also uses Bayesian shrinkage augmented with Pearson/Spearman correlations to check parent-to-child agreement and Kolmogorov-Smirnov and Welch’s t-test consistency check to verify parent-to-child distribution score matches, to shrink small estimates toward parent averages while trusting larger samples.
Output: Top highest-risk findings per analysis type with risk scores and diagnostic context.
LLM Analysis: Translates statistical findings into actionable causal narratives—distinguishing true causality from correlation, explaining root causes, identifying early warnings, detecting fraud patterns, and delivering strategic interventions including sourcing recommendations, recall candidates, and lemon law risk mitigation.
Layer 3: Exploratory Analytics (What patterns exist?)
This layer discovers hidden failure modes, emerging fraud behaviors, and systemic quality issues that rule-based systems miss. It identifies the unusual (anomalies), the naturally occurring structure (clusters), and the economically dominant drivers (Pareto concentration)—detecting patterns before they become financially obvious.
The system applies clustering algorithms, dimensionality reduction, ensemble anomaly detection, and economic impact analysis- Pareto with ABC classification. These techniques reveal patterns such as premature wear linked to specific batches, dealer networks with statistically abnormal claim signatures, or plant-level drift that have not yet breached traditional thresholds.
Output: Integrated Pattern Intelligence
The system delivers three complementary analytical layers:
Clustering profiles validate pattern quality via mathematical scores, track temporal trends (accelerating vs. declining issues), and classify risk levels across eight hierarchies—from fleet-wide manufacturing defects to individual VIN lemon candidates.
Anomaly rankings across seven detection methods identify high-confidence outliers, flagging cost volatility, repeat failure patterns, and potential fraud with statistical confidence thresholds.
Pareto distributions apply 80/20 analysis with ABC classification (Critical/Important/Routine) to quantify the vital 20% of issues driving 80% of warranty costs across four impact dimensions: total cost exposure, risk-weighted severity, repeat failure burden, and anomaly concentration.
Outputs prioritize recommendations and cost attribution models enabling early warning, risk identification, and issue detection.
LLM: Synthesizes the high risk rows from each pattern cluster into business-ready intelligence across eight analytical perspectives: Next Best Action, Corrective Strategies, Recommendations, Fleet-Level Quality Trends, Make-Model Reliability Insights, Part Failure Modes, Plant Manufacturing Issues, Dealer Fraud Risk Indicators, Part-Subcategory Failure Patterns, VIN-Level Lemon Law Exposure, and Vendor Supply Chain Risks—transforming raw cluster data into actionable intelligence with concrete examples that enable immediate strategic decision-making and targeted interventions.
Layer 4: Preventive Analytics (How do we stop it?)
This layer identifies problems before they become crises by detecting subtle early-warning signals that traditional monitoring systems miss. It monitors warranty data for statistical anomalies, abrupt shifts in claim behavior, emerging seasonal cycles, and early signs of system instability—enabling interventions weeks to months before failures reach critical thresholds. By analyzing warranty dynamics in near real-time, it converts reactive firefighting into proactive prevention, detecting small deviations while they are still cheap to fix, before escalating into recalls, claim surges, and brand-damaging events.
The system employs statistical process control techniques such as change point detection, trend validation, multi-method anomaly consensus, entropy analysis to measure system unpredictability, and spectral analysis to uncover hidden cycles—separating signal from noise.
Output: Control charts with change velocity measurements (how fast problems are accelerating) and regime shift markers (when processes fundamentally change) to trigger immediate action.
LLM: Synthesizes critical early warning signals into intervention planning narratives delivering Early Degradation Signal Interpretation (lead time quantification), Hidden Cyclical Pattern Uncovering (seasonal spike prediction), Regime Change Identification (business impact assessment and root cause hypotheses), Component Degradation Pattern Analysis (linking spectral signatures to failure modes), Preventive Maintenance Recommendations (optimal intervention timing windows based on drift velocity and entropy thresholds), and Monitoring Priorities (specifying tracked metrics, escalation thresholds, and control chart violations demanding immediate action)—preventing cost escalation and quality deterioration through proactive, time-sensitive interventions.
Layer 5: Predictive Analytics (When will it happen? Future Projection, Forecast)
This layer functions as an early-warning and risk-detection system, not just a planning tool. It answers what is starting to go wrong, where is it emerging, how fast is it spreading, which vehicles are likely to fail next month, which parts are trending toward recalls, and how much reserve is needed under worst-case scenarios. By learning from historical failure patterns and vehicle/part characteristics, it generates leading indicators, personalized risk scores, and time-to-failure forecasts that surface issues early enough to intervene—enabling targeted inspections, supplier/process corrections, optimized maintenance actions, and selective recalls before problems materialize at scale. It also quantifies catastrophic tail risk—rare, high-severity events that can trigger mass recalls, legal exposure, or budget shocks—shifting the organization from reactive crisis response to proactive risk mitigation.
The system combines three complementary forecasting approaches: survival analysis to predict next-failure events at the unit level; time-series forecasting including seasonal, cyclic and stationary trends, volatility, variability, autocorrelation patterns, randomness, normality, variance stability, directional predictive power, and future projections to forecast claim volumes with uncertainty bands; and Extreme Value Theory (EVT) to estimate the probability and expected magnitude of rare, catastrophic warranty losses in the heavy tail—identifying devastating events that could trigger mass recalls, legal action, or budget crises.
Output: Survival curves with time-to-failure predictions and confidence intervals, claim volume forecasts and projections with uncertainty bands (best/expected/worst-case scenarios), and extreme tail risk distributions with financial exposure estimates for catastrophic scenarios.
LLM: The top high-risk scenarios are synthesized into proactive resource planning narratives including Next Failure Prediction (timing windows and geographic concentration with financial exposure estimates), Part Failure Timeline Forecasting (most likely failure modes), Plant and Dealer Risk Ranking (frailty variance analysis), VIN-Level Recurrent Event Forecasting (personalized risk scores for high-exposure candidates), Extreme Event Forecasting (intervention timelines before catastrophic failures), Resource Planning Recommendations (capacity needs for predicted claim surges), Worst-Case Scenario Analysis (financial exposure estimates and recall risk assessment), and Predictive Maintenance Schedules (optimized by survival curve inflection points and hazard rate acceleration)—enabling proactive resource allocation and intervention before failures materialize.
Layer 6: Unified Synthesis
Consolidates all analytical findings from classic ML models and advanced statistical metrics into multiple delta lake tables, executive summaries, and interactive dashboards with comprehensive, evidence-backed insights and prioritized action items.
Layer 7: LLM Intelligence (What should we do?)
Delivers prescriptive recommendations through:
• LOTUS – Augments rows with semantic metadata enabling richer LLM interpretation
• DSPy – Programmatic reasoning orchestrating multi-step LLM behaviors
• LangGraph – Adaptive orchestration pipeline execution
To optimize for low latency and cost, the LLM consumes only the top 10–30 critical, high‑risk signals from each analytical layer—reducing token usage by ~99.998% while preserving analytical depth through strong coverage (broad, comprehensive scanning) and completeness (detailed, actionable context).
ALL metrics gather from UIL feed data to LLM at 2 levels:
- Local Analysis (LOTUS): Top critical 30-50 rows for Row-by-row deep analysis
- Global Analysis (DSPy): Generates advanced tertiary pattern analysis across dataset
The dual approach ensures a local row-by-row microscopic and detailed analysis of high risk and critical issues, and the macroscopic trend detection of all the critical data points.
- Knowledge Graph with LLM analysis: The system translates a LLM query into a graph query plan, extracts a bounded, question-relevant subgraph (nodes, edges, and weighted attributes), and provides that subgraph to the LLM as evidence context.
- Causal inference analysis: It estimates the causal impact of defined “treatments” (e.g., high-risk dealers, repeat events, extended repairs) on warranty outcomes using EconML LinearDML, then uses DSPy/LLMs to turn the statistical results into actionable insights and an executive dashboard while persisting outputs to Databricks tables.
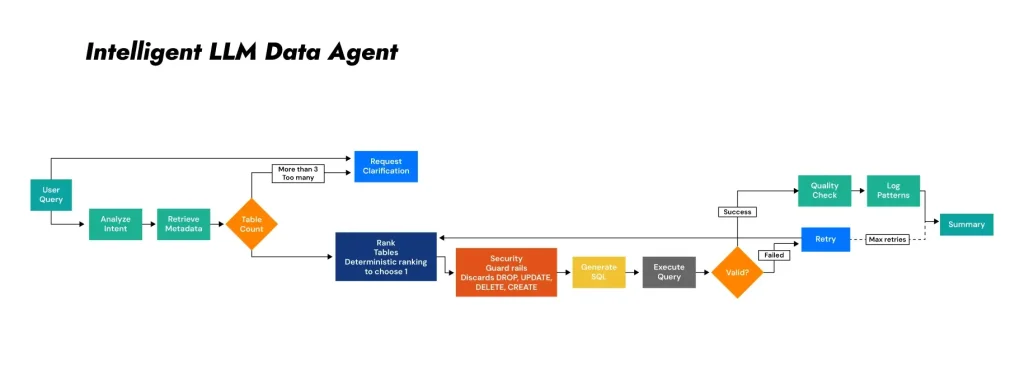
Intelligent Data Agent (Table Analytics Intelligence)
Tables: UIL generates 200+ curated tables across all quantitative analytical layers. The Data Agent converts natural-language requests into valid table selections and executable SQL queries.
User query: Candidate table identification
The agent decomposes requests into intent, entities, metric category, and required aggregation level. It retrieves candidate Unity Catalog tables using hybrid search combining FAISS vector similarity, governed metadata (table and column descriptions, tags, lineage, trust levels, and layer attribution), and persistent memory tracking prior successful queries. For larger inventories (200+ tables), the semantic layer is built on FAISS for scalable retrieval.
Excessive matches: Guided refinement and disambiguation
When multiple tables plausibly match the requested query (threshold of >3 candidates), the agent performs disambiguation by issuing targeted clarification questions to resolve ambiguity before execution. The agent prompts users to extend the scope of the query (totals vs. rankings), level (fleet vs. entity vs. VIN), and type (summary vs. detail vs. statistical).
Limited matches: best-table selection via hybrid ranking policy
When the candidate set is small (≤3 tables), the agent selects the best table using hybrid composite scoring combining deterministic ranking (semantic relevance, data grain consistency, computational cost) with LLM-guided final selection with explicit reasoning. A fallback table is designated for retry attempts.
SQL generation with security guardrails
The LLM agent generates SQL that is validated against security policies: only SELECT statements are permitted. Attempts to execute DROP, DELETE, UPDATE, INSERT, TRUNCATE, ALTER, or CREATE operations are automatically blocked before execution. Autocorrections include appending LIMIT clauses and ORDER BY for critical columns.
Governed execution with performance controls
Queries execute against Unity Catalog with 300-second timeout limits, automatic LIMIT clauses (max 100 rows for standard queries, 50 rows for detail tables), and multi-attempt self-correction (up to 3 iterations with fallback table). Execution monitoring tracks row count, execution time, and result size with performance acceptability threshold of <30 seconds.
Top N extraction and interpretive summarization
The agent returns top records relevant to the objective and provides a concise narrative summary of key drivers, notable exceptions, and directional trends, with metadata excerpt for traceability and reviewability. Results include data quality scores (0-100 scale with Excellent/Good/Fair/Poor ratings), grain verification, double-counting risk assessments, confidence levels, and execution of metadata.
Adaptive learning with persistent memory
The data agent maintains persistent query memory tracking successful table selections and failure patterns, conversation memory for multi-turn dialogues (2,000 token limit with automatic summarization), and query execution logs with performance metrics (timestamp, table, SQL, success status, row count, execution time, data quality score). Learning mechanisms include memory boost scoring for high-success tables, keyword-to-table pattern recognition, and complete audit trails. Memory persists automatically after every query execution.
Conclusion
UIL represents a fundamental shift from reactive analytics to proactive intelligence. By integrating statistical surveillance, advanced machine learning, and orchestrated LLM reasoning—while tightly constraining LLM input to high-evidence findings—organizations can deploy early-warning capabilities that are resource-efficient, operationally reliable, strategically actionable, and responsibly governed.
Built on Databricks with Unity Catalog and MLflow, UIL provides a production-ready foundation for warranty early-warning systems that scale across enterprise data, maintain rigorous governance, and deliver measurable business value.

Operationalization & Future Direction
In the next paper the focus is on addressing critical enterprise challenges of extracting meaningful insights from massive unstructured corpus without incurring prohibitive costs or sacrificing analytical quality, introducing the “Top N Strategy”—a three-stage intelligent filtering approach combining pre-filtering, adaptive Pareto sampling, and information density scoring—alongside comprehensive drift detection, LangGraph orchestration, and production-grade LLMOPS monitoring to ensure reliability and responsibility, that transforms LLM outputs into auditable, governed assets with measurable business impact.