Using the Blob Tools to Output Data into Formatted Excel Templates
While “the Blob” might sound like a cheesy horror movie or an unidentified substance you scrape off the bottom of your shoe, in Alteryx it can be a very powerful tool. “Blob” is an acronym for “Binary Large OBject” data, which is a collection of binary data stored as a single data point.
Now, if your eyes have glazed over or you’re thinking “So what?!”, here’s why that is so helpful: you can use this tool to templatize your outputs!
I’ve seen a lot of use cases where developers have created a template report in Excel (a P&L report, a tax return input, a summary sales report, etc.) and they’ve saved this template report on a secure network drive. The plus to this is that they have total control of the template – there won’t be any unapproved changes or accidental deletes by end users. Unfortunately, that’s also the downside – the end users don’t have access to the report.
In this use case, we have an xlsm template file saved to our “Secure Network” folder. We want to save that file, with all formatting and the macros, to a shared folder location using the blob tool. Then, we’ll configure our standard workflow output to write updated data to this file.
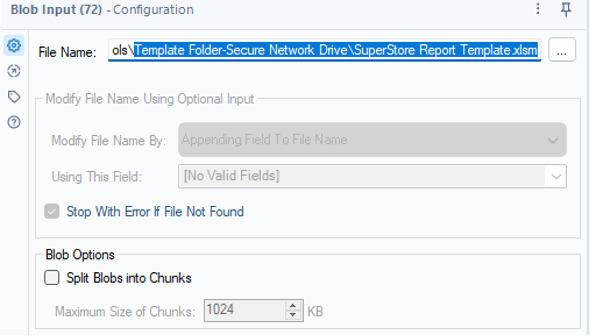
Our Template File Location:
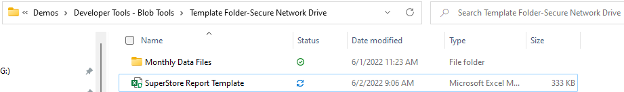
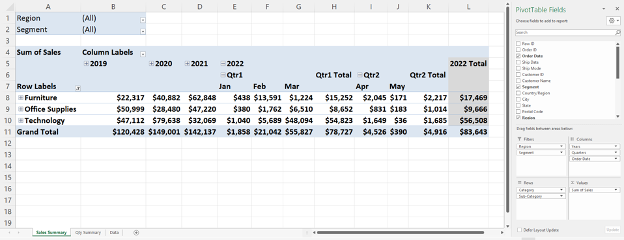
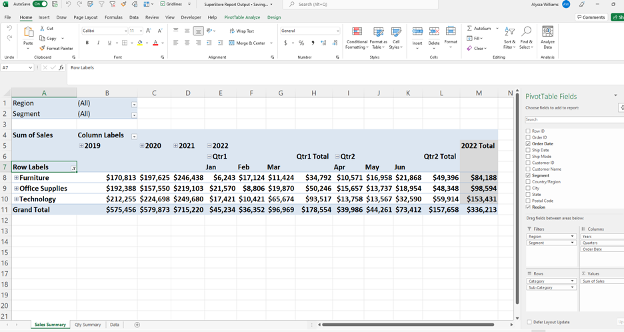
Our Template Report:
Our Excel template report has the “Sales Summary” and “Qty Summary” tabs which contain pre-built PivotTables that will refresh automatically on workbook open, via VBA code.
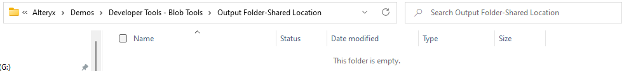
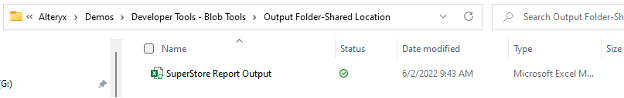
Our Shared File Location:
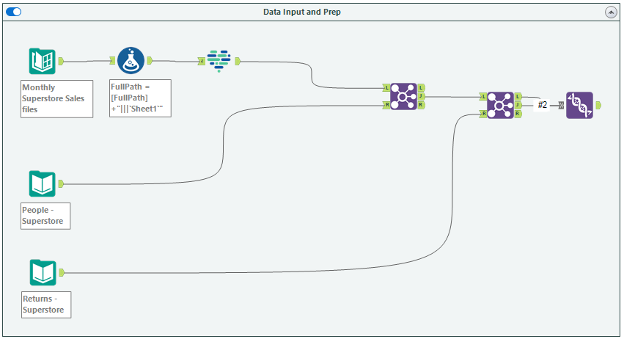
The Workflow
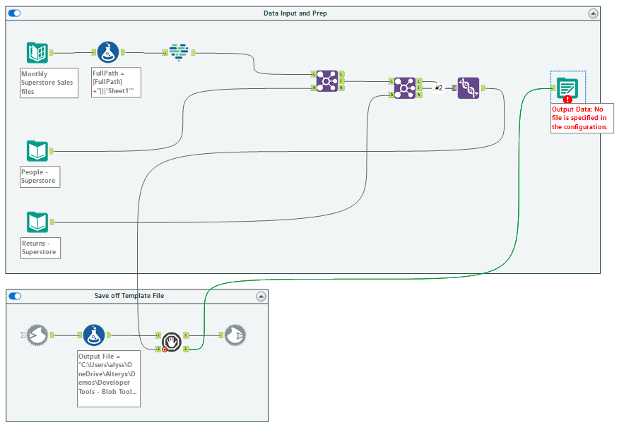
In the below snapshot, you can see a typical Alteryx workflow.
We could add a standard output tool to our union tool and output the data to our “Secure Network” folder and the “SuperStore Report Template”; however, we’d then have to manually copy and paste this file to our “Shared Location” folder.
We could also output directly to the “Shared Location” folder; however, this would just output the data and we’d have to rebuild our PivotTable tabs, and we’d lose our auto-fresh macro. Neither option is ideal. This is where the blob tools come in!
The Blob Input Tool
From the “Developer” tool pallet, add a blob input tool to your canvas. The blob input tool has an optional input anchor. For this scenario, we won’t connect anything to the optional input anchor, but this can be helpful when reading in multiple input files (aka: multiple formatted files!).
To configure the blob input tool, we’re going to search for the input file to populate the “File Name”. Here, we’ll input the template file that is saved in our “Secure Network” folder.
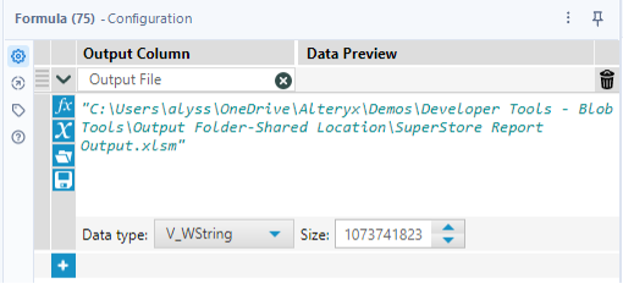
Formula Tool: Define Output Location
Following your blob input, you’ll need to connect a formula tool. Add a field for “Output File” which contains the output location and the output file name you would like to use. In this case, we want to save the file to our “Shared Location” folder with a file name of “SuperStore Report Output”.
Pro Tip: CReW Parallel Block Until Done Tool
If you haven’t already downloaded the CReW macro pack (which is totally free!), I highly recommend adding this tool pallet. There are a whole host of helpful tools! You can find the download here.
Before adding the blob output tool to our canvas, we’re going to add a CReW parallel block until done macro. This allows us to control what order our tools run in and will ensure that we move our template file to the shared location before we write data to that file from our existing workflow.
The parallel block until done macro has two inputs and two outputs. We’re going to connect our formula tool to the first input, and we’ll circle around to the other anchors in a bit!
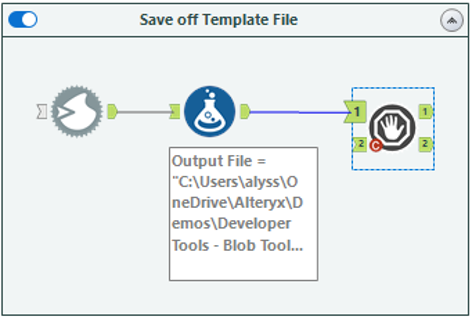
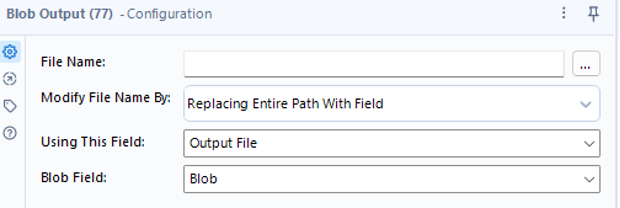
The Blob Output Tool
We’ll now add a blob output tool to our canvas and connect to it the first output anchor of our parallel block until done macro. Since we’re creating a new output file, I’m going to configure my blob output to “Replace Entire Path with Field” and select the “Output File” field I created using my formula tool.
And that’s how you use the blob tools! If you were to run your workflow now, you’d see that the template file is moved and saved to the “Shared Location” folder. It includes our VBA code as well as our two PivotTable tabs.
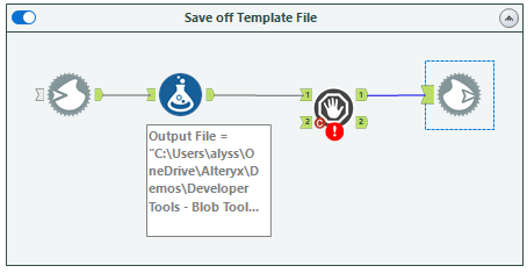
Integrate with Standard Workflow
Now that we have our template saving to the shared location, we need to integrate our existing workflow, so that we’re updating this new file with the most recent data each month.
To do this, we’re going to connect our union output anchor to the second input anchor of our parallel block until done macro. Then, add a standard output tool to our canvas, which will connect to the second output anchor of our parallel block until done macro.
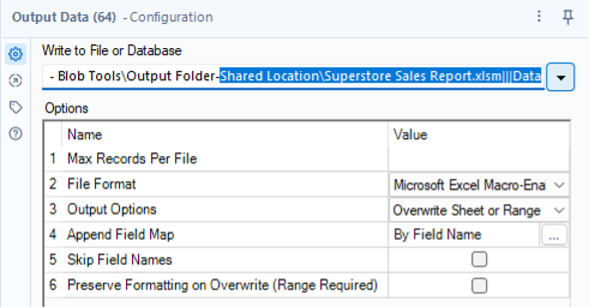
To configure the standard output tool, we want the output path to match the output path that we provided in our formula tool. There are a few different ways to do this, but for this scenario I’ve just copied the file path from the “Output File” formula and appended the sheet name we want to output to (in this case, our sheet is called “Data”). Since the sheet already exists, be sure to set your output options to “Overwrite Sheet or Range”.
When you run this workflow, it will first generate our formatted, macro enabled report and save it to the shared folder location. Next it will write any updated data to the report file. You can verify this by running the workflow and opening the output file from the shared location. You’ll see that the June 2022 data has been automatically added into our PivotTable. Our report is working as expected!
Putting it into Practice
Having a template file saved to a secure/non-shared location is just one example of a blob tool use case, but the possibilities are endless. You could combine the blob tools with user interface tools, to allow users to upload their own templates to update. You could combine the blob tools with a directory input tool to read in and then output multiple files. Get creative!
Alteryx is a powerful tool that can provide efficiency and scalability. I enjoy helping clients recognize value by finding better ways to automate their business data processes, then using the time savings to identify business value and insights in their data. To learn more about how I and Lovelytics help clients do more with their data, please visit us at https://lovelytics.com/or connect with us by email at [email protected].