We use data and analytics every day to answer those “W” questions: Who purchased our new product? Which carrier has the best on-time delivery record? What customer segment drove our change in sales? But how often are you faced with a “Where” question and you’re unable to find a quick and easy answer?
Say you work in the marketing department for a bike shop with two locations in Nashville, TN. You have a list of customers, their location information, and some of their sales history. You want to run a targeted “summer service” promotion for customers who have either previously come to the shop for service or have purchased a bike from the store. Given that customers are spread across Tennessee and Kentucky, you would really prefer to target customers that live in a 50-mile radius of one of the two store locations. They ask you to help them identify which customers meet these criteria.
We’ll start by importing our customer data file and our bike store location file into Alteryx. We will use a filter tool so that we filter our analysis to only include customers where “Past Service?” or “Bike Purchase?” equals “Yes”.

From here, we need to convert our geographic fields (Latitude and Longitude) into points so that Alteryx recognizes them as spatial fields. To do this, we’ll use the “Create Points” tool. We’ll drag two of these tools onto our canvas, connecting one to the “True” output anchor of our filter tool and the other to our bike store location input.

To configure the create points tools, you simply assign the longitude and latitude fields in your data to the appropriate fields in the create points tool configuration window.
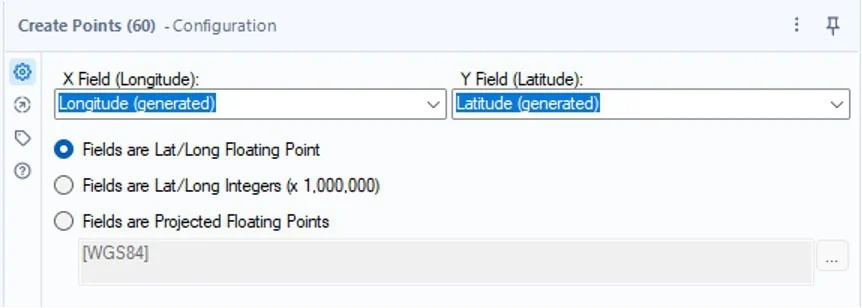
The create points tool will add a column to your data entitled “Centroid” and you’ll see that you can insert a browse tool to view the results in a map.

Once you’ve created points for both your customer data as well as your bike store locations, add the “Find Nearest” spatial tool to your canvas. The find nearest tool has two input anchors. A required “Target” input anchor, which should always be the group of records you’re trying to identify as “in bounds” for analysis. There’s also an optional “Universe” input anchor, which gives you the option to connect directly to a file or database, rather than another step in your workflow.
In this case, we’re going to connect our customer data to the “T” input anchor and our bike store locations to the “U” input anchor.

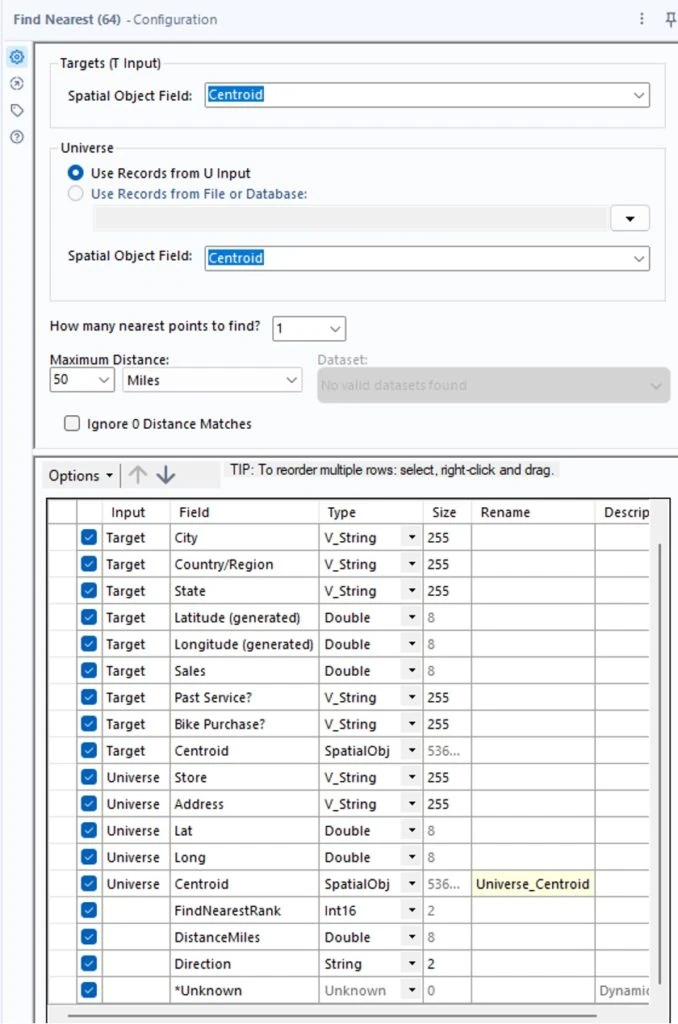
The configuration pane of the find nearest tool can be slightly intimidating, but never fear! First, you’ll want to identify the spatial object available in both your target and universe inputs. In this case, it would be the centroid fields from our create points tools.
I typically like to set my distance and unit of measure next. This is how large of a radius you want your analysis to cover. In this case, we want to identify customers within a 50-mile radius of either one of our bike stores.
From here it’s easier to interpret the question of “How many nearest points to find?” In our example, we only have two bike stores. It could be possible that both locations are within a 50-mile radius of the customer. If we were to set this to two, both locations would be returned, since both meet the 50-mile radius criterion. For our marketing campaign, we really only want to identify the first closet bike store, so we’ll set this value to 1.
You’ll also notice that there is an embedded select tool. This tool will contain all the fields from your target data source (our customer data), all the fields from our universe data source (our bike store locations), and then 3 new fields that are generated as part of the find nearest tool.
“FindNearestRank” identifies a ranking of locations, which is helpful if you opted to include more than 1 option in the “How many nearest points to find?” question. The nearest option will be ranked first, the second nearest option will be ranked second, etc.
“DistanceMiles” identifies the distance in your selected unit of measure between the target location and the universe location. In our case, this would be the customer’s address location and one of our two bike shops.
“Direction” will identify what direction the target would need to travel to reach the universe destination.
Once you’ve ran your workflow, you’ll see two output anchors on the find nearest tool. The “Matched” records are all records that are within the specified distance, while the “Unmatched” records are all other records.
We can clean up our data by adding a formula tool and rounding our distances to the nearest tenth of a mile. We can also add a select tool to remove any unnecessary fields. From here, we have a clean list of customers who have either come to our shops for service or bought a bike from us, and that are within 50 miles of one of our two store locations. These are the customers we will want to send our targeted “summer service” promotional ad to!

While spatial analytics is a step beyond standard data prep and output, it can be a vital tool to better understand and find valuable insights in geographic data. Alteryx is a powerful tool that can provide efficiency and scalability. I enjoy helping clients recognize value by finding better ways to automate their business data processes, then using the time savings to identify business value and insights in their data. To learn more about how I and Lovelytics help clients do more with their data, please visit us at https://lovelytics.com/or connect with us by email at [email protected].