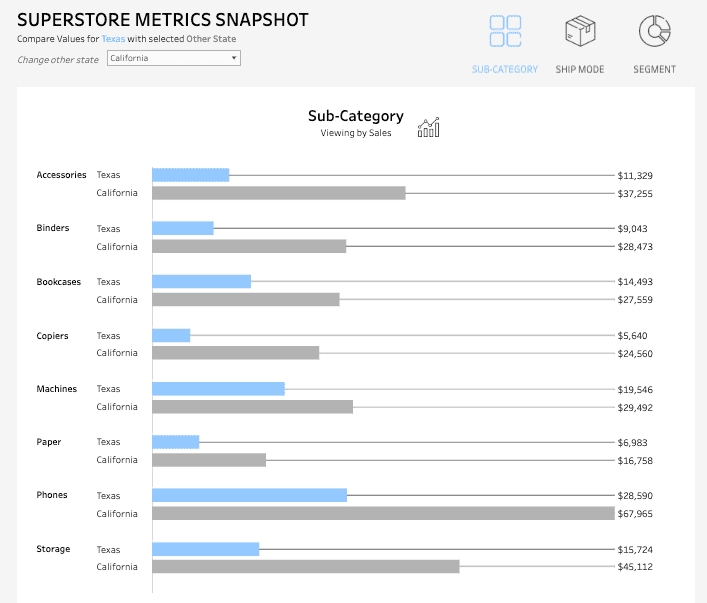
There are a variety of scenarios in which we may want to compare one singlevalue of a categorical field in our data set against another value from thatsame field. In its simplest form, this can be achieved by applying a filter based on thedimension that only shows the...
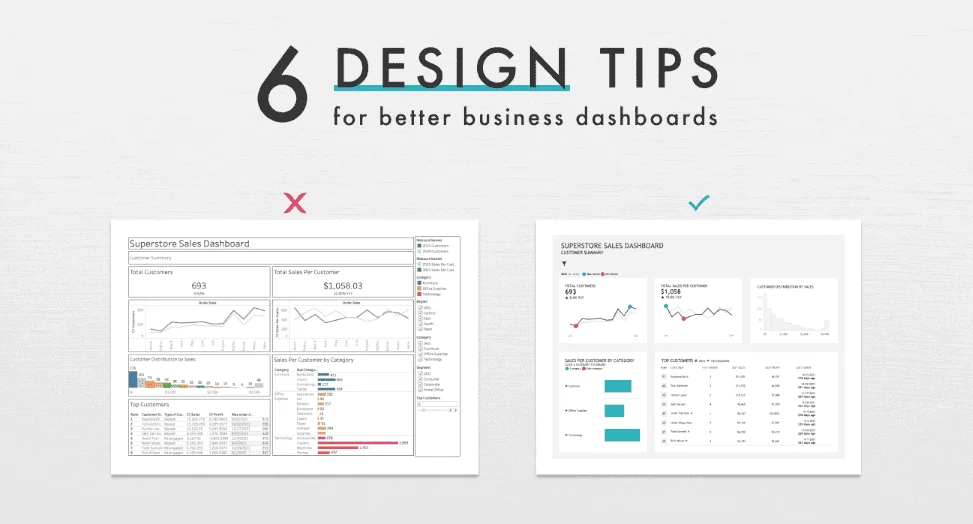
The phrase coined by Henrick Ibsen “A picture is worth a thousand words”, is a great reminder of the power of data visualizations in telling a story with data. To effectively use data to tell a story we need to make sure our dashboards support, not hinder our...
Lovelytics, a Gold Sponsor at this year’s Tableau Conference 2022 , is being well represented by our best and finest data visualization consultants. With a Tableau Visionary (formerly Zen Master), Tableau Ambassadors and frequent contributors to enable and...
One feature of tableau prep is the ability to help with data cleansing. Data cleansing is the process of detecting and correcting (or removing) corrupt or inaccurate records from a dataset, table, or database and refers to identifying incomplete, incorrect,...
When working in Tableau, I find there are instances where we might want to color a text table based on a dimensional field, or maybe more specifically, a type of KPI. For example, lets say we have the table view below of Sales by Sub-category and Segment, and we want...
Designing An Effective Enablement Strategy Training has always been a key component of success for organizations making the transition from outdated, difficult technologies to faster, more powerful processes. After all, what good is new software if no one knows how to...