Now Possible: Dynamic Tableau Map Layers, Opening the Door to Deeper, Easier Data Analysis
Tableau released 2020.4, delivering expanded enterprise data capabilities, including unlimited geospatial map layers. These dynamic Tableau map layers open the door for enterprises to do more in-depth, advanced location-based data analysis.
What exactly can you do with this new Tableau feature? Let’s find out.
The Power of Tableau Map Layers
Previously, in Tableau, you had a few options if you wanted to display more than one data set on a map.
You could build multiple maps, each displaying one spatial data set. This method kept you from visualizing different data sets within the same map.
You could also use a Tableau extension to create a map showing more than one set of data. One issue with this approach is that you can’t use Tableau Public while using an extension.
Another option before Tableau 2020.4 was to use a program outside of Tableau to make your data-layered maps. Doing so was cumbersome and time-consuming, forcing you to use Tableau to build some dashboards and another tool to create map visualizations.
Not anymore. Now you can build dynamic Tableau map layers within a single map using Tableau 2020.4.
Multiple Dynamic, Customizable Layers
Let’s say you want to see your store locations in proximity to where your customers live and how your customers can reach your stores.
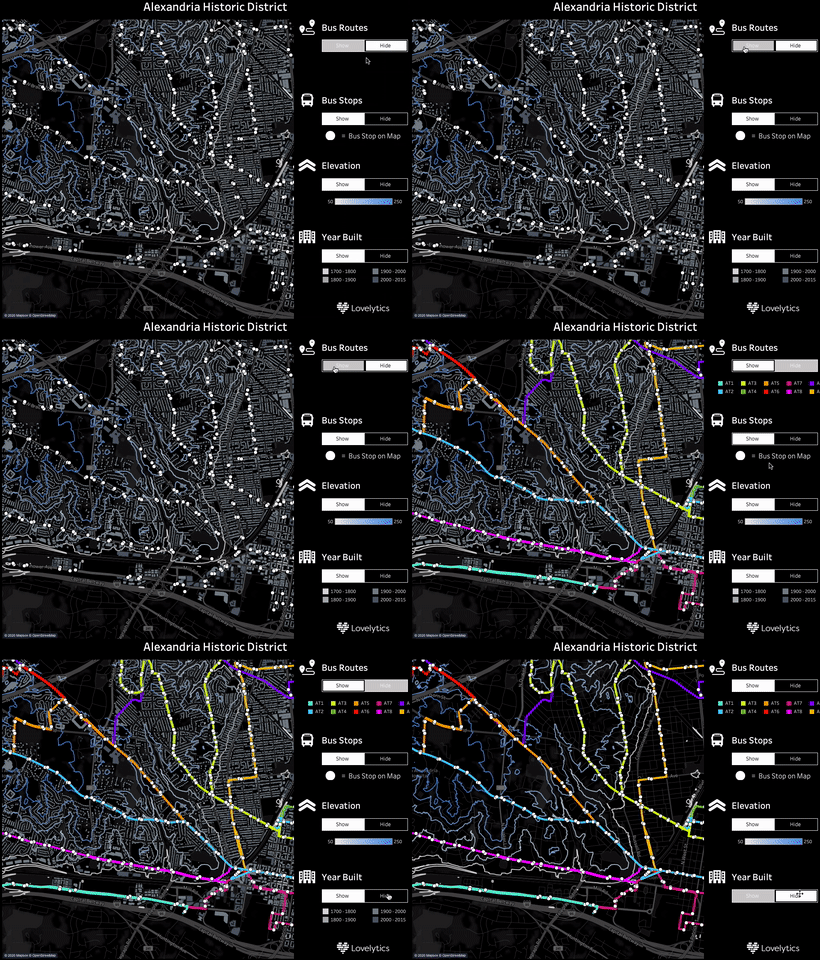
Using Tableau 2020.4, you can make layers of each of these data sets: store locations, customer addresses, public transportation options. Next, you add this data to your map as individual dynamic Tableau map layers.
Doing so lets you visualize where your stores are, where your customers live, and how they can reach you. You can toggle each layer on and off, and you can stylize each layer.
For example, you can customize your customer location layer to display each customer based on how much they spend at your stores. You can show your stores by monthly sales, daily foot traffic, or the building’s age housing your stores.
Whatever geospatial data you have, you can display it as a dynamic Tableau map layer.
You can illustrate bus and subway routes and stops. You can show fire hydrant and street light locations. Where employees live, elevation changes, rainfall amounts, and more.
And you can visualize this data in dynamic, customizable Tableau map layers within one map.
Go Deeper With Your Spatial Data
Tableau 2020.4 is a powerful release that enables advanced geospatial data visualization.
You can now use Tableau to bring together spatial layers and context into a single, customizable map. No more extensions, maintaining multiple single-layer maps or using more than one program to visualize your geospatial data.
If you’re interested in learning how the new mapping features in Tableau 2020.4 can enhance your Tableau deployment, reach out to us for a free consultation at [email protected].
