This is Blog#2 In A 3-Part Series on HL7 and Healthcare Data Interoperability
In Blog #1 of the series, we showed you how to get set up with Smolder and start parsing your HL7 data. Now we’re going to show you how to start processing that data while building out a simple Medallion Architecture.
For those unfamiliar with the Medallion Architecture, it is an architecture design pattern that consists of landing data in successively cleaner Delta Lake Tables from bronze to silver to gold. We’ll start off by using the same ADT messages from the previous blog post and land our raw HL7 data in bronze tables. We’ll then parse and process our data before landing the cleaned data in silver tables. Finally, we’ll perform business aggregations to form our gold layer and run some simple SQL queries to gain quick insights into our patient data.
Smolder
Currently, Smolder is only available for use in Scala. For those who are more comfortable with PySpark, we’ll show you a workaround in this post that takes advantage of the flexibility to use Scala, SQL and Python within the same notebook in Databricks.
Raw to Bronze
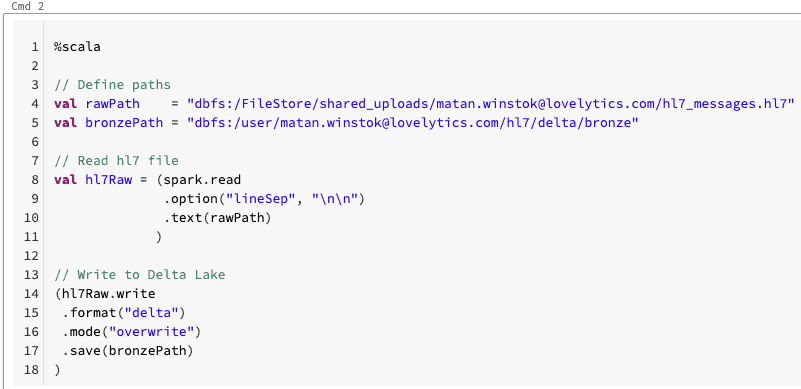
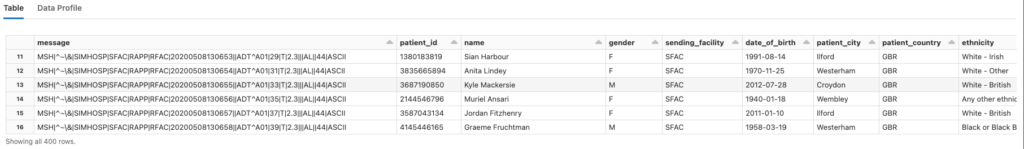
We start off by reading in our HL7 file via the Spark DataFrameReader API and writing the result to Delta Lake. Notice how we are using the %scala language magic command which lets us run this cell using Scala.
Bronze to Silver
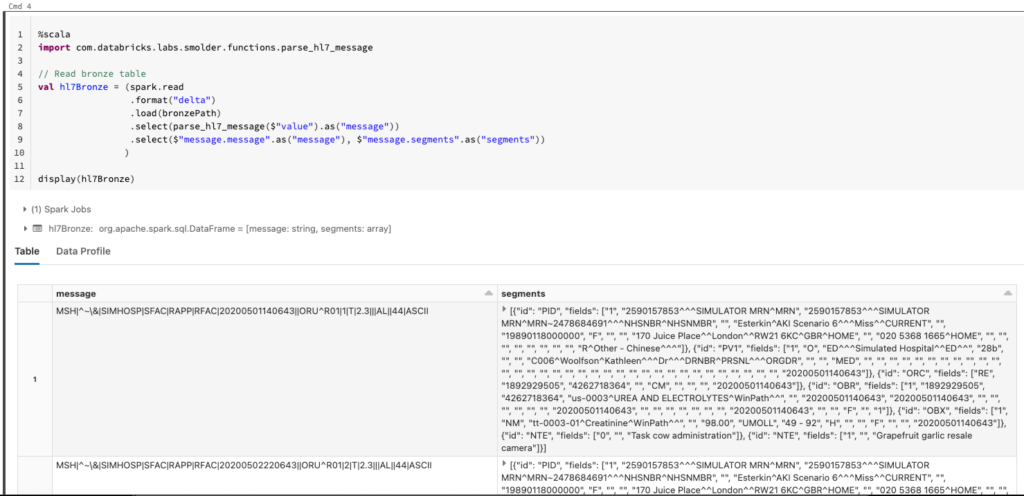
We read in the bronze table from Delta Lake in Scala. So far, this should look very familiar to the steps performed in Part 1 of this series.
PySpark
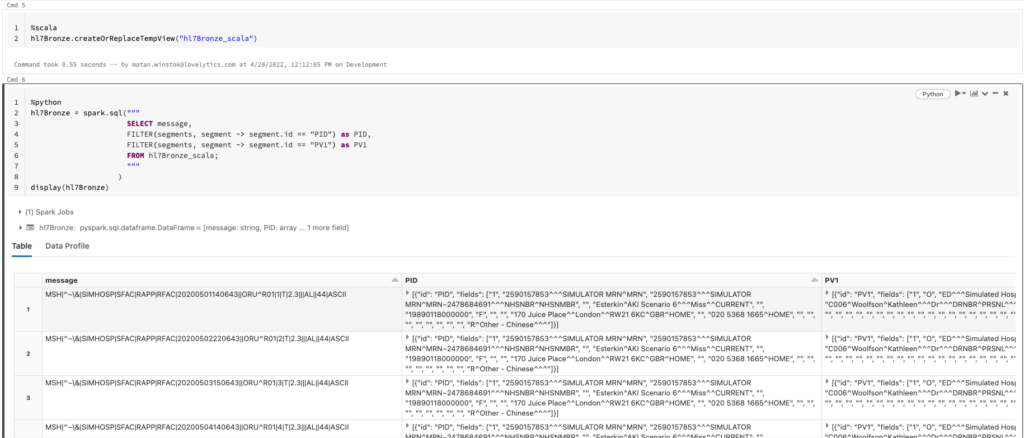
Now we want to use PySpark to continue processing our data, but how do we do that? Remember that workaround mentioned earlier? This is where it comes into play. First, using the %scala magic command we create a temporary view of the bronze table so that we can access it with SQL. We then perform an intermediate step in SQL where we filter for the message segments that are of interest to us and restructure our DataFrame so each segment is in its own column. From there, we can use the %python magic command and spark.sql() to reference the bronze table in PySpark. Going forward we don’t explicitly use the %python magic command anymore as the default language for this notebook was chosen to be Python.
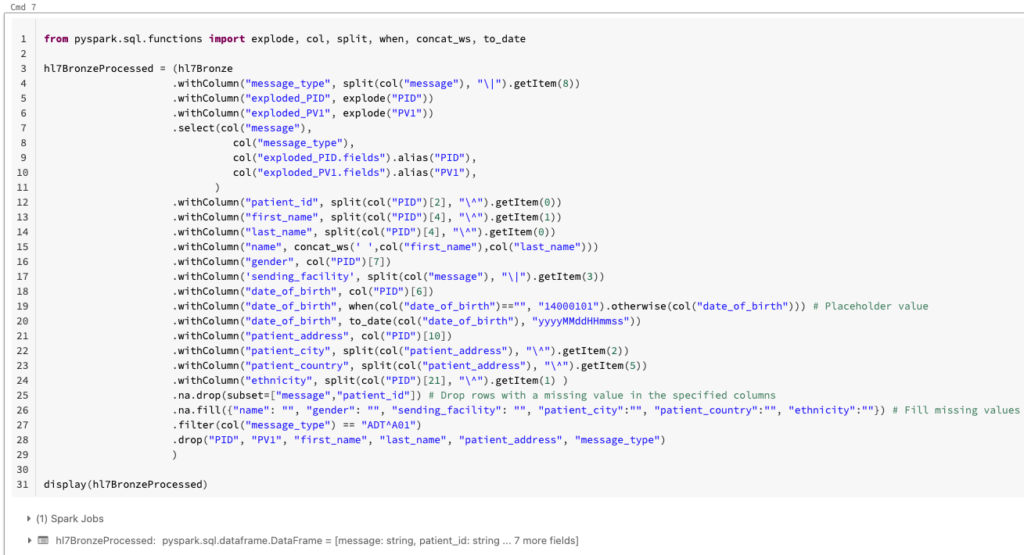
We can now process our data in PySpark. We start off by extracting the message type by using the split() function. Our sample data contains both ADT_A01 and ORU_R01 messages. For this blog post, we are only interested in ADT_A01 messages and use the message_type column to filter out ORU_R01 messages.
You’ll notice that we then explode our segment columns on lines 5 and 7. In order to better understand the reasoning for this, some background is required. A characteristic of HL7v2 message segments is that they can be repeated. For instance, for ADT_A01 messages there could be an optional AL1 segment which contains information about a patient’s allergies. This segment could be repeated for the same message depending on how many allergies the patient has. Exploding the column ensures that each record in our DataFrame does not have multiple values under segment columns that are allowed to be repeated (i.e, each record in our DataFrame refers to only one of the patient’s allergies). Although PID and PV1 are non-repeating segments, we still exploded those columns to highlight this point.
We then move on to extracting our columns of interest, performing data quality analytics like dropping rows where we have key information missing, and filling missing values.
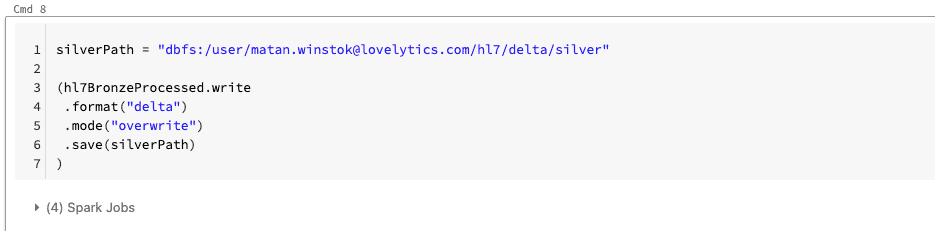
Now that we’ve processed our bronze table we can write it to Delta Lake.

Silver to Gold
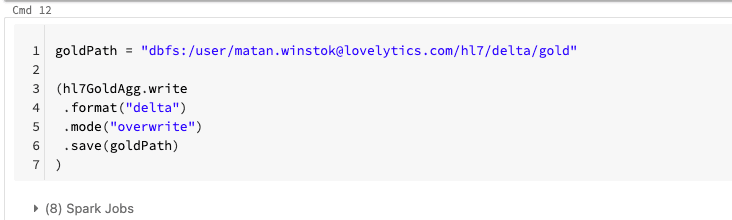
The gold layer is meant for business-level aggregations and in our case we are interested in gaining insights into patient demographics. In this step we read in our silver table, perform aggregations and join it back to our silver table before writing our gold table to Delta Lake.

Patient Insights
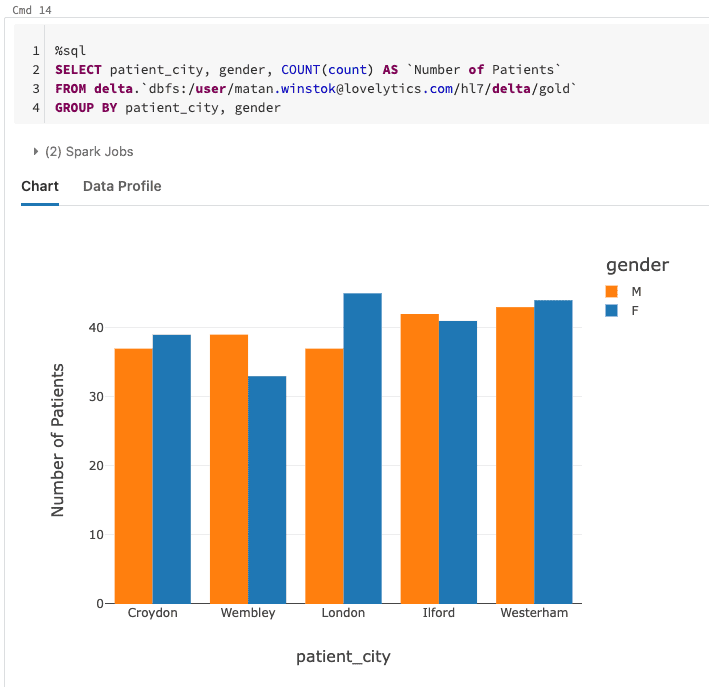
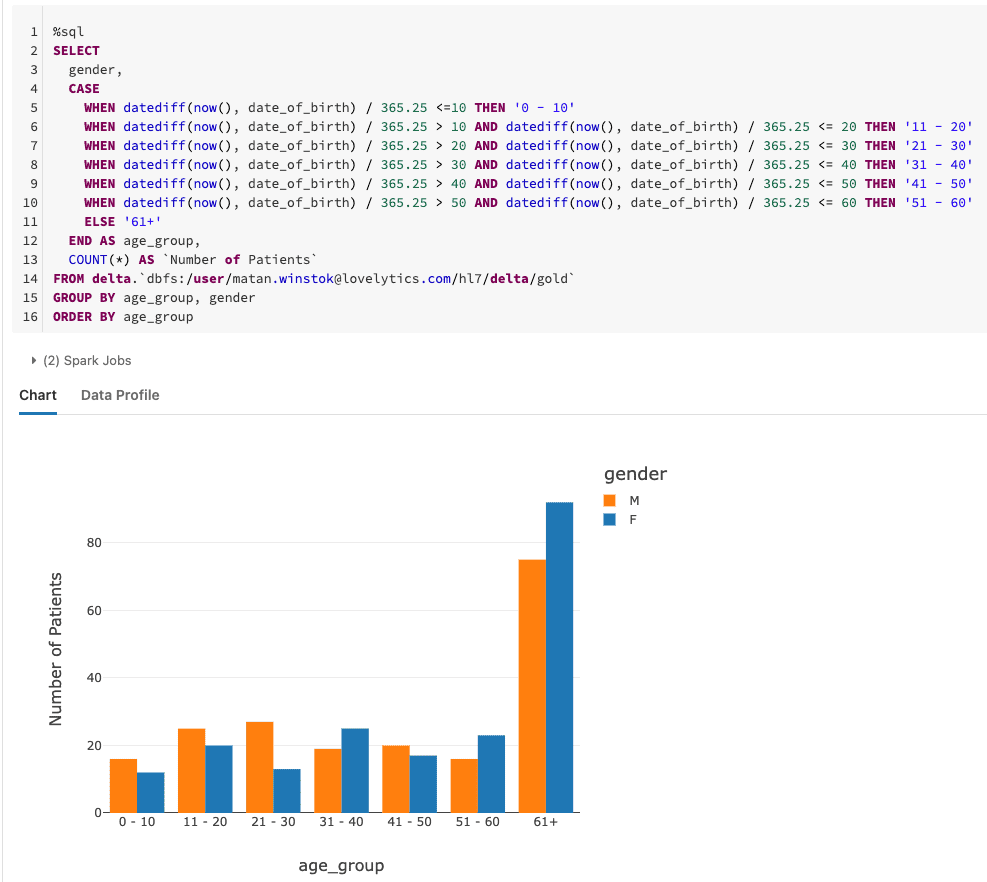
We can use Spark SQL to perform some queries on our gold table to quickly gain insights into our patients. For instance, we can take a look at the number of patients being admitted in each city and see how that varies with gender.
Another simple example explores the number of patients being admitted for each age range. We observe an increase in the number of patients older than 60 being admitted to the hospital.
Summary
In this blog, we’ve demonstrated how to use Smolder to parse HL7 data and build healthcare pipelines in Databricks. We focused on a simple architecture to process ADT messages but the underlying concepts remain the same for extending this to more complex architectures. For instance, what if you want to build an architecture that integrates both HL7v2 and FHIR data sources.
This brings us to the topic of Healthcare Interoperability Tools. Click here to read Blog #3 in the 3-part series.
Lovelytics is a preferred partner of Databricks and has helped many clients install and configure their Databricks instances. To learn more please visit us at www.lovelytics.com/partners/databricks or connect with us via email at [email protected]
Healthcare Interoperability is a focus for Lovelytics and Databricks. Please join us at the Databricks AI Summit on June 27-30 2022 in San Francisco to see Healthcare Interoperability in action. Click here to register to attend.