Insights Into Your Diversity & Inclusion Goal Attainment Progress
You can't improve what you don't measure. This especially holds true for important, yet complex initiatives like improving your company's overall diversity and inclusion scores. Lovelytics created an accelerated way to visualize your organization's D&I scores.
Download Tableau Workbook
Measure and Monitor What's Important
I Want To Learn More
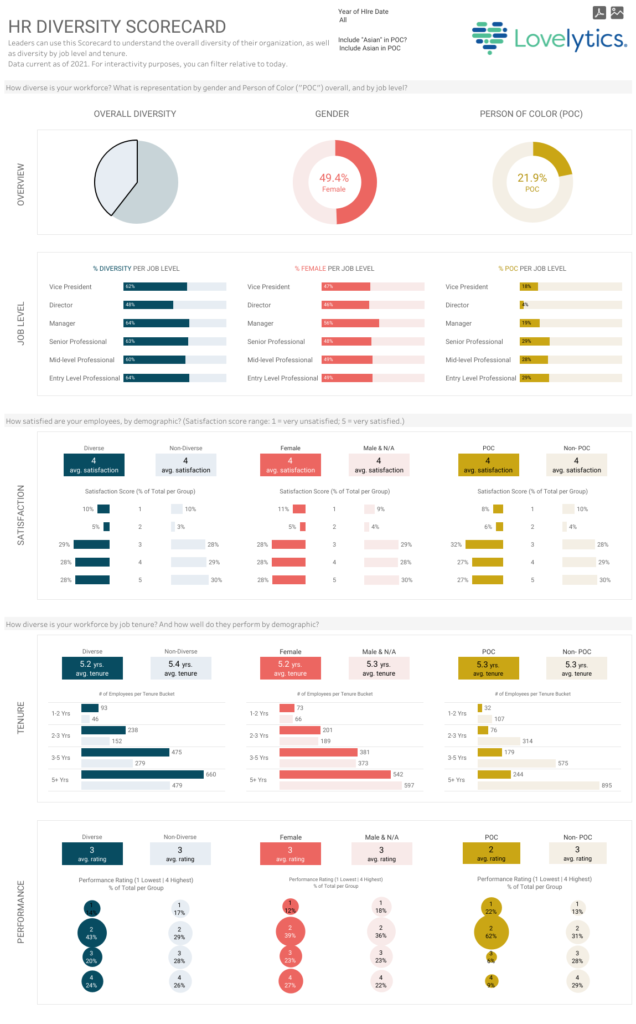
This Accelerator provides insights into the diversity of your organization.
Leaders can use this to understand
Overall representation among your employee base by women and Persons of Color;
Diversity by job level and tenure;
Employee satisfaction by demographic;
Employee performance by demographic.
Answers Key Business Questions
How diverse is my organization, overall?
What’s the gender distribution in my organization?
What percent of my organization are Persons of Color?
How are diverse is our organization by job level?
How satisfied are our employees, by demographic?
How does employee performance compare, across demographics
We use cookies to ensure that we give you the best experience on our website. If you continue to use this site we will assume that you are happy with it.OkPrivacy policy