
por Nigel Silva | Oct 10, 2022 | Data Analytics, Data Applications, Data Science, Data Strategy, Visualización de datos, Databricks
Synopsis: This article is a 101 level introduction to Databricks SQL, and will walk you through the steps to build simple visualizations directly within a Lakehouse environment. The article is focused around the UI and workflow of DBSQL and assumes the reader has...
por Cait Sojka | Oct 4, 2022 | Visualización de datos, Uncategorized
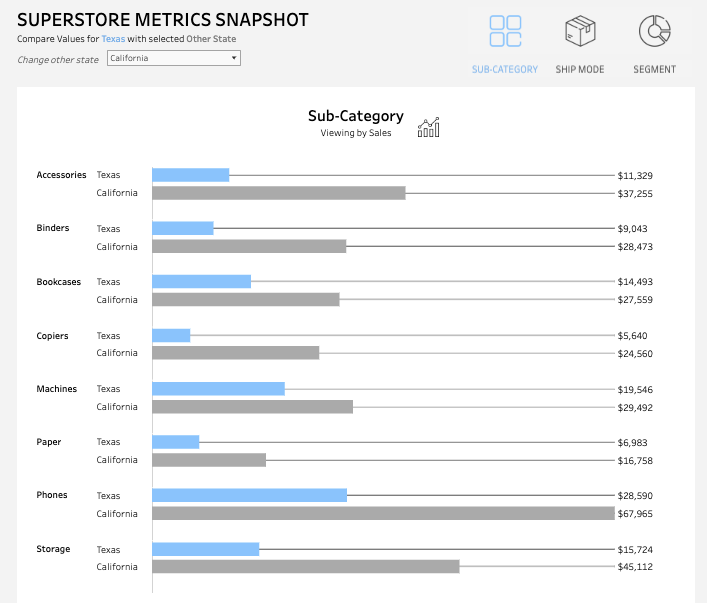
There are a variety of scenarios in which we may want to compare one singlevalue of a categorical field in our data set against another value from thatsame field. In its simplest form, this can be achieved by applying a filter based on thedimension that only shows the...
por Agata Ketterick | Ago 29, 2022 | Visualización de datos, Tableau
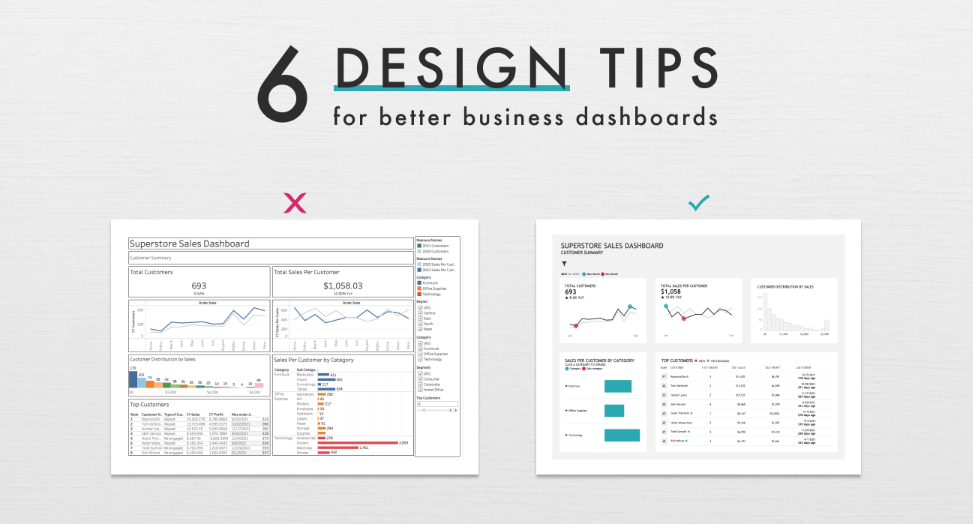
The phrase coined by Henrick Ibsen “A picture is worth a thousand words”, is a great reminder of the power of data visualizations in telling a story with data. To effectively use data to tell a story we need to make sure our dashboards support, not hinder our...
por adminlovelytics | Abr 28, 2022 | Data Analytics, Data Strategy, Visualización de datos, Tableau, UX
Lovelytics, a Gold Sponsor at this year’s Tableau Conference 2022 , is being well represented by our best and finest data visualization consultants. With a Tableau Visionary (formerly Zen Master), Tableau Ambassadors and frequent contributors to enable and...
por Sekou Tyler | Mar 31, 2022 | Data Analytics, Visualización de datos, Recursos
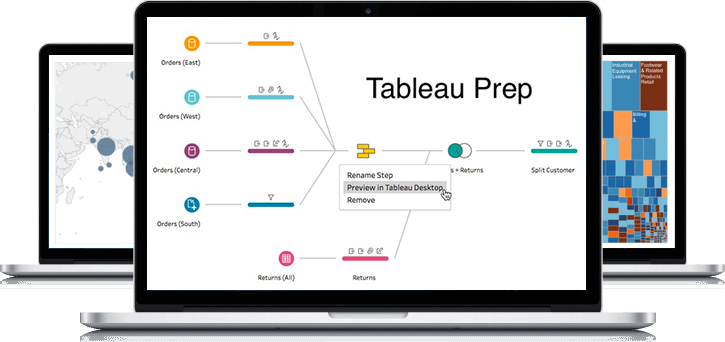
One feature of tableau prep is the ability to help with data cleansing. Data cleansing is the process of detecting and correcting (or removing) corrupt or inaccurate records from a dataset, table, or database and refers to identifying incomplete, incorrect,...
por Oliver Inca | Mar 25, 2022 | Data Analytics, Visualización de datos, Tableau
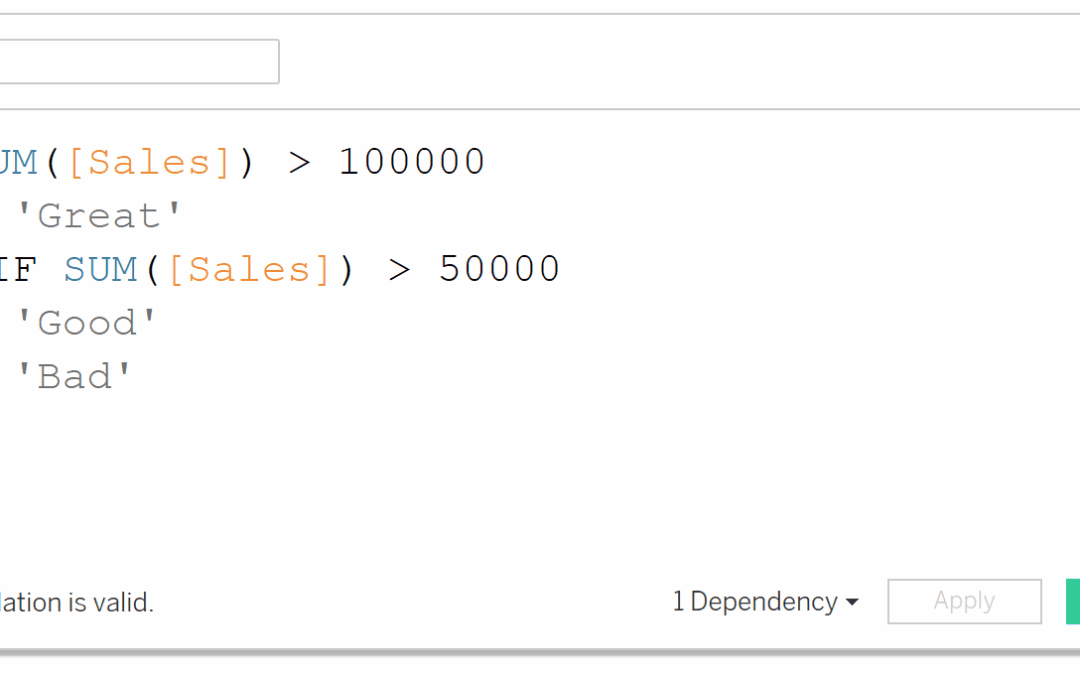
When working in Tableau, I find there are instances where we might want to color a text table based on a dimensional field, or maybe more specifically, a type of KPI. For example, lets say we have the table view below of Sales by Sub-category and Segment, and we want...