Have you ever added a formula tool to your Alteryx workflow and suddenly realized that your IF/THEN logic is starting to look more like a book and less like a logical function? Or maybe you really miss the ability to simply reference a prior row’s result within an Excel function? In either scenario, you might be asking yourself: “There has to be a better way to write this formula!?”
There’s good news! The Alteryx Multi-Row tool allows you to reference results in prior or subsequent rows across multiple columns! In today’s blog post, I’ll walk through how to use the Alteryx Multi-Row tool to calculate a conditional running total, as well as apply tiered discounts to sales charges. You could apply similar logic to tiered pricing or taxes due based on tiered tax brackets (ex: United States federal tax rates).
Prefer to watch the workflow build? Check out the how-to video here!
Want to follow along? Download the workflow here!
The first two steps in our workflow prep the data for use in the multi-row tool. We transposed the pricing tier data so that the tiers, the lower range, the upper range, and the rate each had their own column. Then we joined that information with the gross usage charge transactional data.
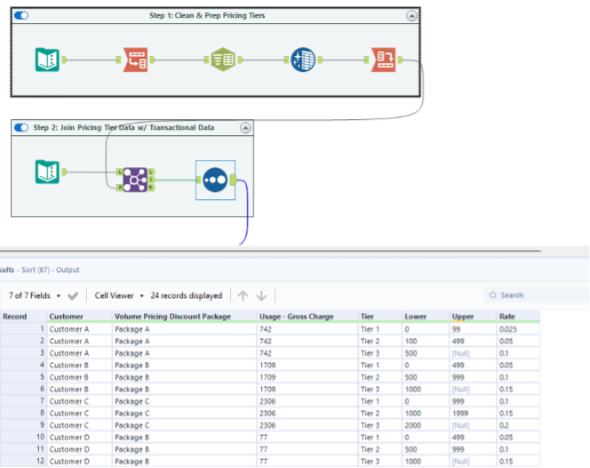
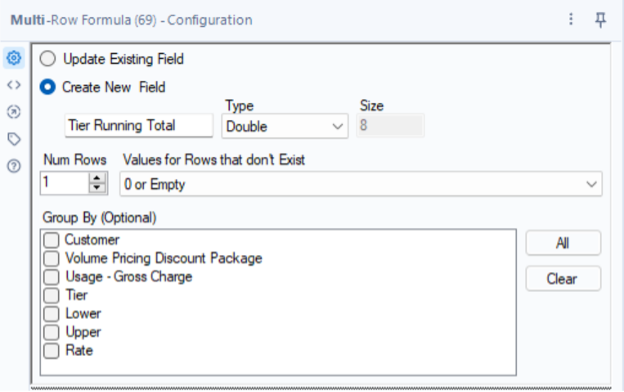
From here, we add our first multi-row tool. There are a few key components to the configuration window of the multi-row tool.
In the top section of the tool, you’ll see that you can choose to update an existing field or create a new field. For this tool, we’re going to create a new field and call it “Tier Running Total”. This will essentially be the running total of each tier level based on the tier’s lower/upper range and the actual usage charge. You also have the option to group your data. The group by function is optional and really depends on the function you’re writing and how your data is sorted going into the formula tool.
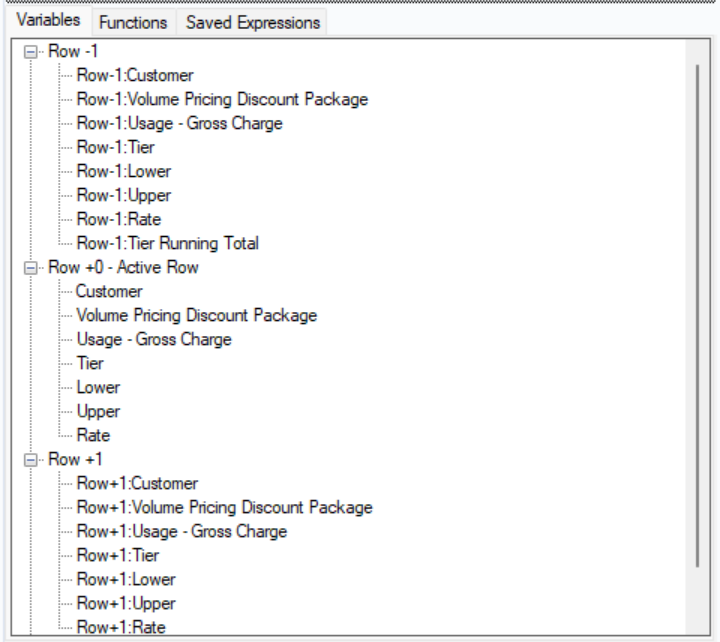
In the middle section of the configuration window, you’ll see variables that are available to use within the function calculation. The key here are the three groups:
- Row -1: These reference the selected field from the prior row of data
- Row +0 (Active Row): These reference the selected field from the current row of data
- Row +1: These reference the selected field from the next row of data
Finally, the bottom section of the configuration pane is where you will actually write your function.
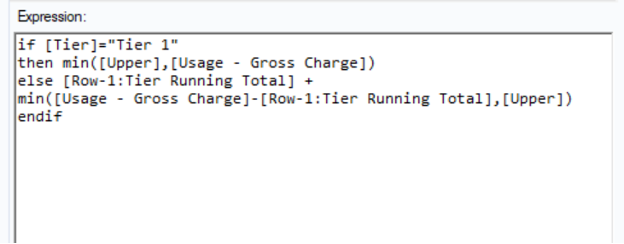
So let’s break down the function we use to create our running total:
- Tier 1 – this tier serves two purposes:
- Since we’ve sorted our data by customer name & tier, this indicates that we’ve started looking at charges for a new customer, so we don’t want to reference any prior rows (as those pertain to a different customer).
- This is the base of all future calculations for a customer – tier one can either be the upper range of tier one OR it could be usage charge itself, if the usage charge is less than the upper range. We apply the MIN function to apply the minimum of those two results
- Each subsequent tier:
- As with any running total, we always want to reference the previous running total result – this is where we apply the Row-1 reference to the Tier Running Total field we’re creating.
- Because we don’t want to reference a value that exceeds the upper range of the tier, we want to add either the minimum of:
- The total usage charge less the prior row’s Tier Running Total field OR
- The upper range of the tier
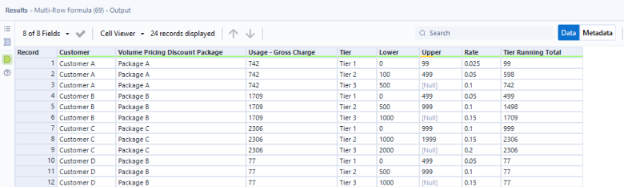
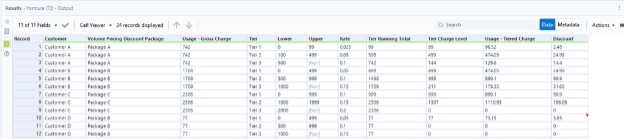
Once we run the workflow, you can see the results:
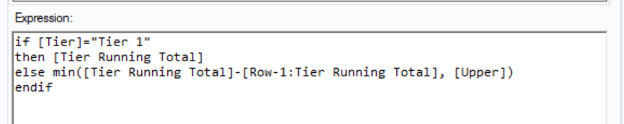
Next, we need to calculate the tier charge level. We’re going to use another multi-row tool for this so that we can reference the prior row running total we just calculated. To determine the actual tier charge level, we want to take the minimum result of either the current row’s running total less the prior row’s running total OR we want to take the upper limit of the tier. Again, this function prevents us from exceeding the upper limit of the tier.
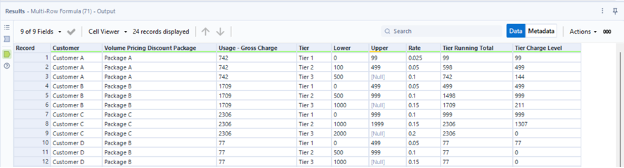
Once we run the workflow, we can review the results:
While we could calculate the tiered usage charge as part of the multi-formula tool, I opted to do this in a standard formula tool so I could use the “Tier Charge Level” field as part of a data validation step. I’ve added a formula tool to calculate the tiered usage charge as well as the discount in dollars:
You’ll notice that while we have the info we need, the actual customer data is still blown out for each tier level. If we want to aggregate this into a summary view by customer, we can add a summarize tool to the canvas:
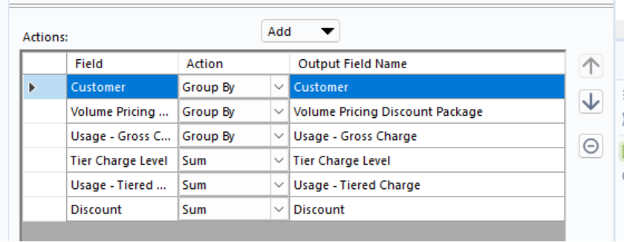
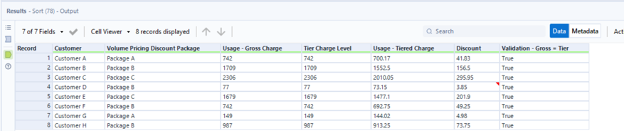
I’ve included both the gross usage charge (the single row item from our transactional data) and the tier charge level (the sum of each tier’s charge amount based on the tier range limits) – if everything is working as it should, these values should be exactly the same. Once the data has been summarized and the check has been added, the final result is a summary by customer of the gross usage charge, the total net usage charge, and the total discount:
The biggest benefit to using the Alteryx multi-row tool to perform this calculation is that it can be fully dynamic – as new tiers are added or as tiers are removed/consolidated, you won’t need to update any IF/THEN logic that specifically names tiers.
Alteryx is a powerful tool that can provide efficiency and scalability. I enjoy helping clients recognize value by finding better ways to automate their business data processes, then using the time savings to identify business value and insights in their data. To learn more about how I and Lovelytics help clients do more with their data, please visit us at https://lovelytics.com/or connect with us by email at [email protected].