Let’s face it – most of us got our analytical starts in Excel. We were asked to create complex functions or automate manual data entry and suddenly we were hooked. We pride ourselves on our ability to stretch the limits of Excel, making it do things it was never meant to do.
But what happens when you’ve pushed Excel a little too far?
- Your SUMIFS or XLOOKUP functions take forever to calculate.
- The file is too big to open efficiently (or open at all – hello 1M row limit!)
- You’ve linked your calculations to so many other files it’s impossible to trace the dependencies.
- You can’t scale and you think your time could be spent doing more high value work.
Do any of these issues sound familiar? Have you downloaded the free 30-day trial of Alteryx Designer, but you’re not quite sure where to start? Here’s a crash course on how to Excel with Alteryx!
Aggregate Functions
If you’re an Excel user, you’re probably familiar with the conditional aggregation functions. Functions such as AVERAGEIFS, COUNTIFS, SUMIFS allow you to aggregate data based on certain conditions.
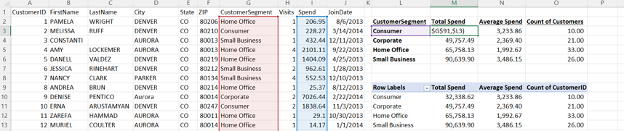
In our example below, we have visit and spend information by customer, with customers grouped into customer segments. If I wanted to find the total spend, average spend, and count of customers by customer segment I could use the SUMIFS, AVERAGEIFS, and COUNTIFS functions respectively (I could also insert a PivotTable and achieve the same results).
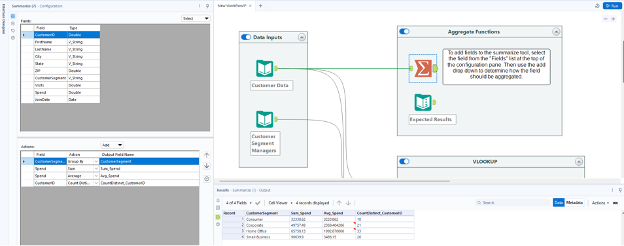
In Alteryx, the “Summarize” tool can group and aggregate data. In the Configuration Panel of the tool, add “CustomerSegment” to the bottom “Actions” using the “Group By” action. Then add Spend with aggregations for both sum and average. Finally, add CustomerID using the count distinct aggregation.
VLOOKUP
Enhancing data is often necessary to provide critical information for data analytics. Using our customer visit and spend data, let’s enhance our data set by adding the customer segment manager as a column in our data.
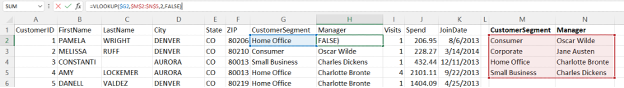
In Excel, we could use a VLOOKUP function to look up the customer segment and return the manager’s name:
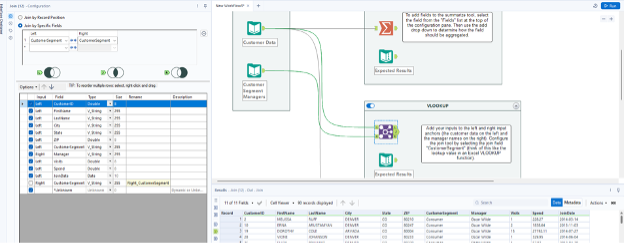
In Alteryx, we can use the “Join” tool to achieve the same result. Connect the Customer Data to the left input anchor of the join tool and connect the manager data to the right input anchor of the join tool. Configure the join tool by selecting the join field “CustomerSegment” (this would be your lookup value in a VLOOKUP function).
Standard Calculations
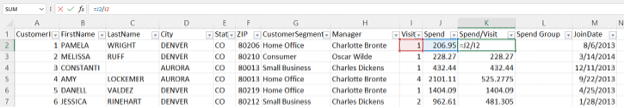
There are times we want to enhance our data by adding columns that contain simple math functions or conditional IF statements. Using our customer data, let’s add two columns: a column for the spend per visit as well as a column for spend group (grouping customers into two groups: customers who spend less than $200/visit and customers who spend $200 or more/visit).
To create the spend/visit column in Excel, you would simply select the spend cell and divide it by the visit cell:
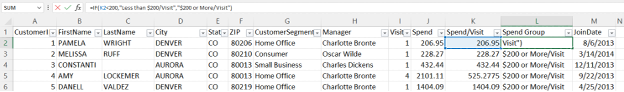
In Excel, you can use an IF function to create the “Spend Group” column:
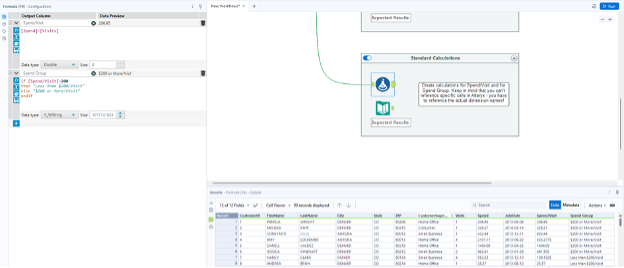
In Alteryx, you can use the “Formula” tool to create these types of calculations. Unlike in Excel, you can’t just reference specific cells to create calculations (like with the spend/visit calculation above). In Alteryx, you have to reference the actual dimensions (the column names), so in this case, your calculation for Spend/Visit is literally the Spend column/Visit column. The conditional calculation for spend group has similar logic to the Excel function, but I typically prefer to use the IF/THEN/ELSE/ENDIF logic format available in Alteryx.
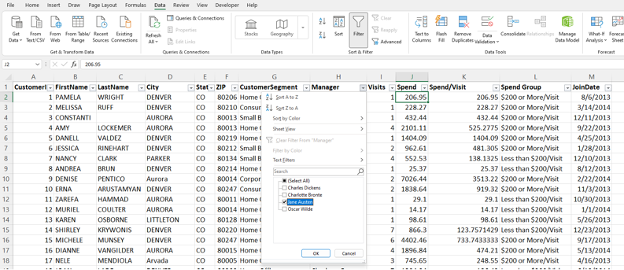
Filters
Say we want to filter down our data set to just a single customer segment manager. In Excel, we could apply the filters from the Data pane, then use the filter button on the column header to filter to a given customer segment manager:
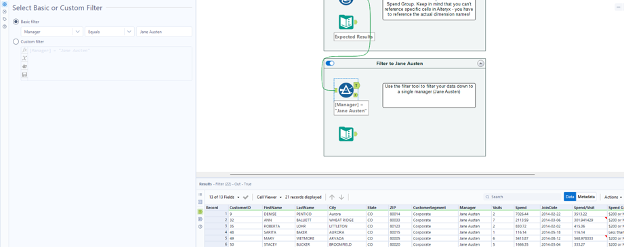
In Alteryx, we can use a “Filter” tool to apply a filter to given column in our data. Below, we’ve used a basic filter on the “Manager” column to filter to only results that equal “Jane Austen”:
Alteryx is a powerful tool that can provide efficiency and scalability to the work users are currently doing in Excel. I enjoy helping clients recognize value by finding better ways to automate their business data processes, then using the time savings to identify business value and insights in their data. To learn more about how I and Lovelytics help clients do more with their data, please visit us at https://lovelytics.com/or connect with us by email at [email protected].