Written by: Alyssa Williams
We use data and analytics every day to answer those “W” questions: Who purchased our new product? Which carrier has the best on-time delivery record? What customer segment drove our change in sales? But how often are you faced with a “Where” question and you’re unable to find a quick and easy answer?
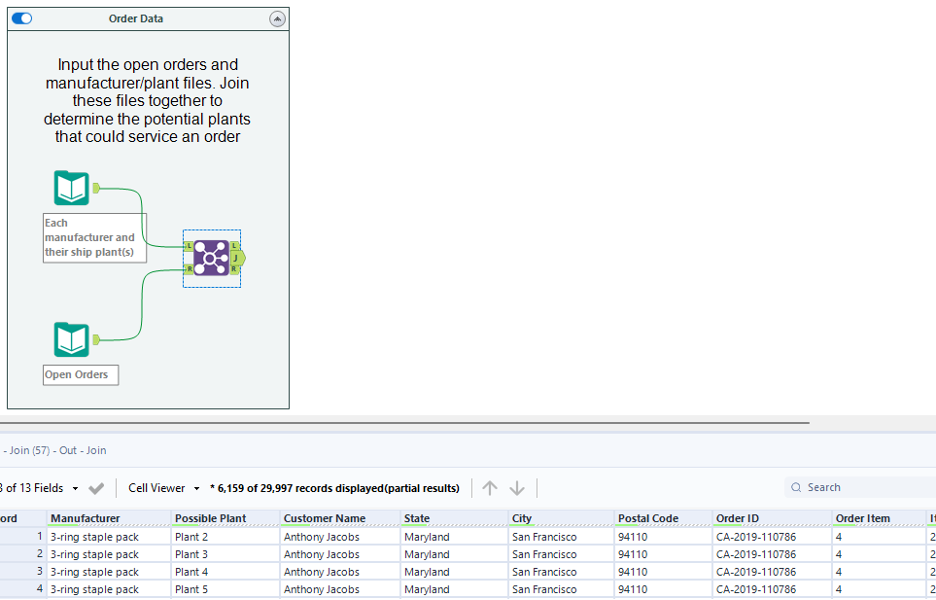
In this case, our “where” question relates to open orders and which plant location should fulfil them. You have a file of open orders that have not been assigned shipping plant locations. Because only certain plants fulfil certain manufacturer brands, you first need to identify which plants could potentially fulfil the order. Then you need to select the final plant based on selecting the plant closest to the customer’s location to minimize shipping costs.
We’ll start by importing our files into Alteryx. We have one file that contains the manufacturer master data and the relationship between which plants can ship which manufacturer brands. We’ll join this data with our open orders to create a data set of all possible order/plant combinations. As an example, you can see that for a given order and line item (CA-2019-110786 line 4) there are 4 possible plants that could fulfil the order.
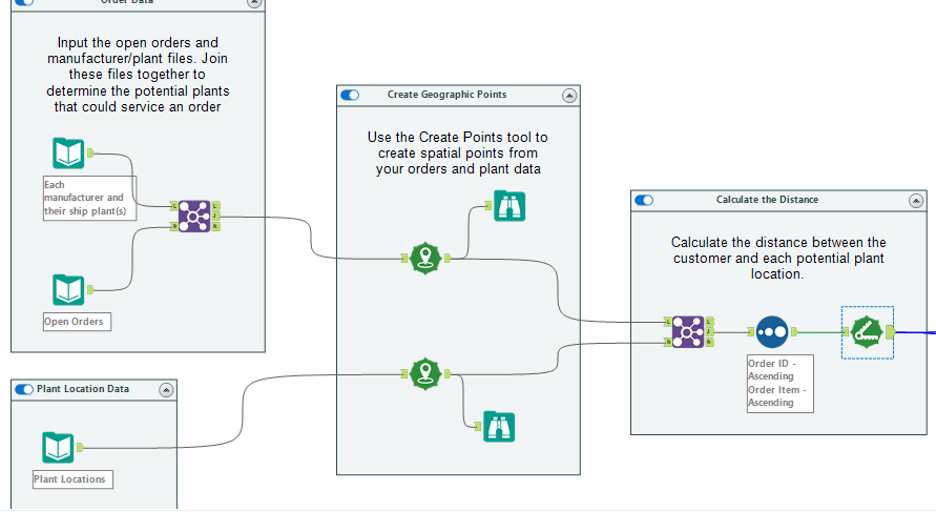
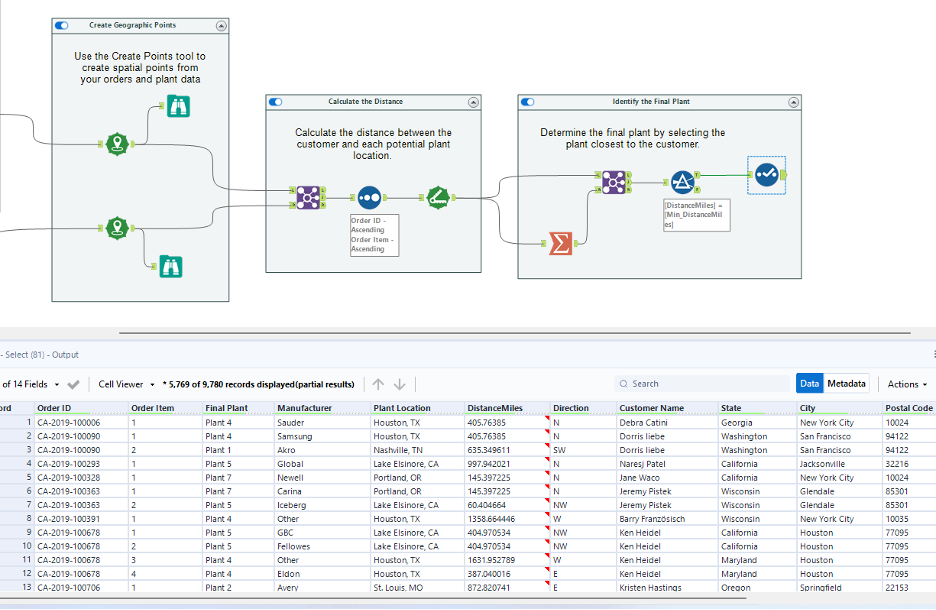
Next, we need to bring in our plant location data. For both our open order data and our plant location data we need to create spatial points so that Alteryx will recognize these fields as spatial objects.
To do this, we’ll add create points tools to both our joined output anchor and the “Plant Locations” input. To configure the create points tools, simply assign the longitude and latitude fields in your data to the appropriate fields in the create points tool configuration window.
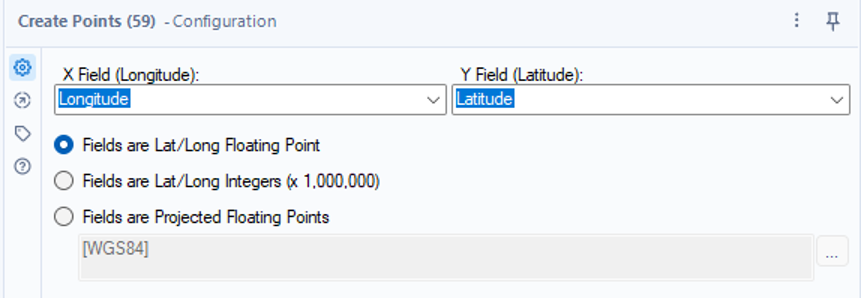
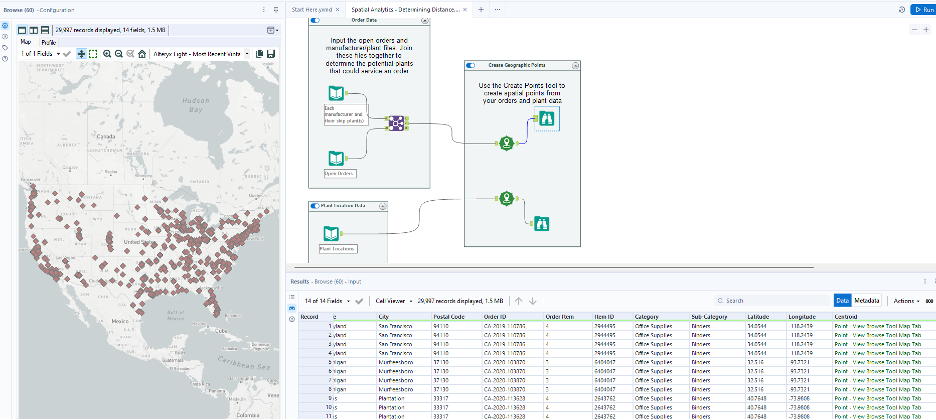
The create points tool will add a column to your data entitled “Centroid” and you’ll see that you can insert a browse tool to view the results in a map.
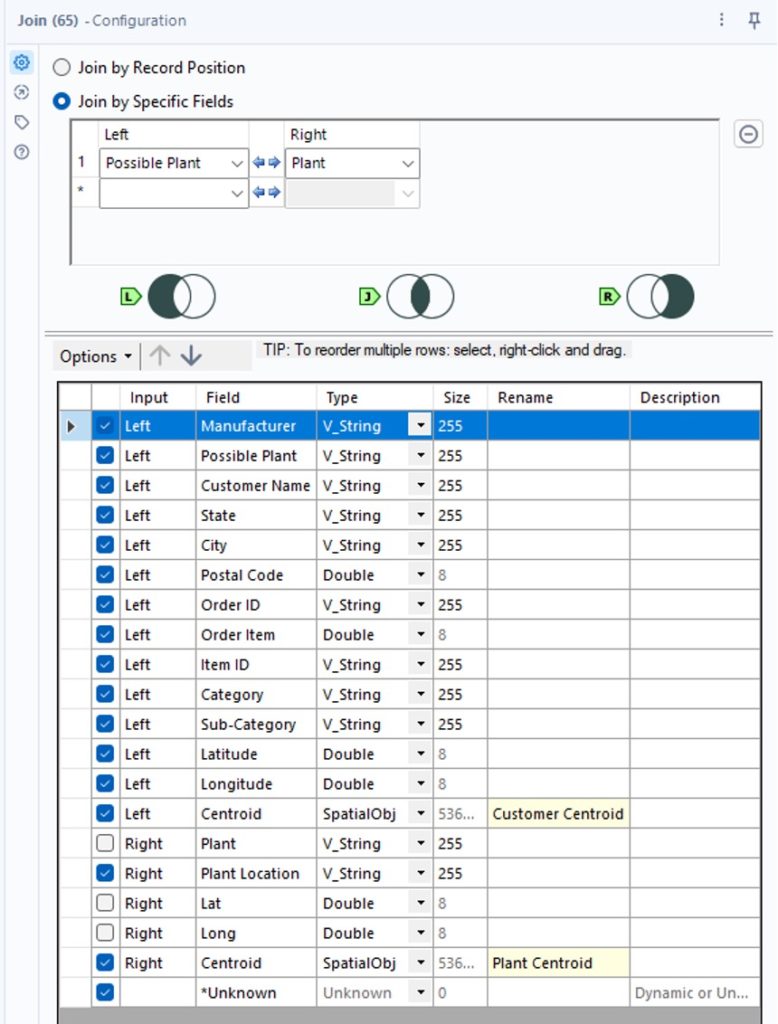
Now, to calculate the distance between these two points that we created (one for each customer location and one for each plant location), we need to join them so they’re in the same data set. To do this, we’ll add a join tool to our canvas. The fields to join on are “Possible Plant” from our open order data and the plant field from our plant location data. You’ll see that we now have our open order information, a “Customer Centroid” field for each customer location, and a “Plant Centroid” field for each plant location.
From here, I will go ahead and insert a sort tool, because I like to see all of my orders sorted by order ID and order item. Then we will insert a “Distance” tool from the spatial tool pallet.
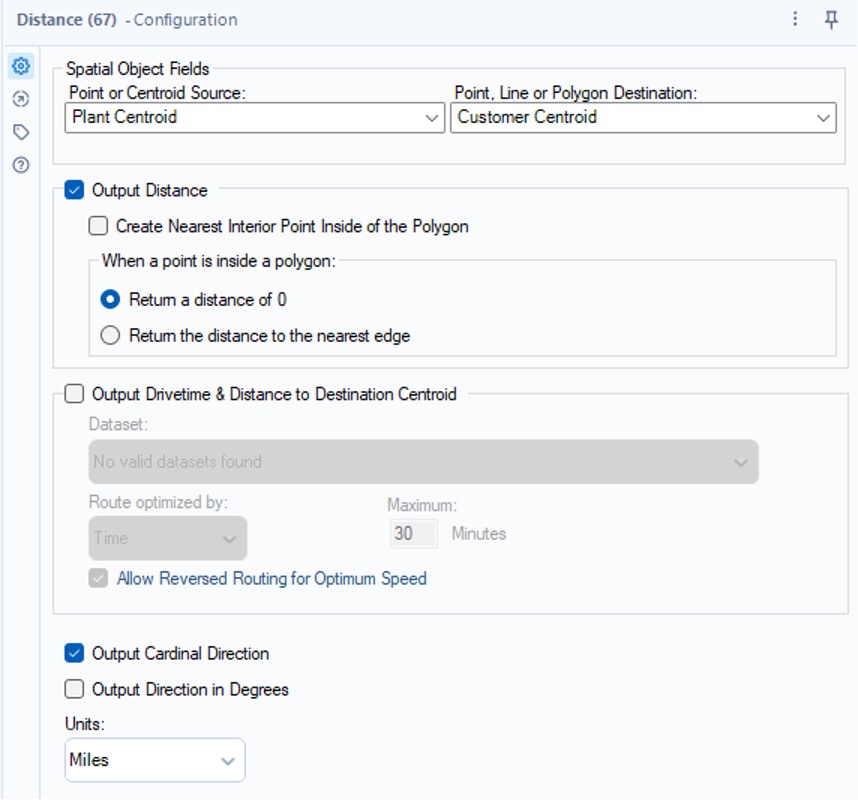
To configure the distance tool, you need to assign the source spatial object and the destination spatial object. In this case, our source is our plant location, and our destination is the customer location. You’ll also want to select the “Output Distance” option and the unit of measurement you’d like to use. For this, we’ve configured an output distance in miles, and we’ve checked the box to include the direction of travel.
Once you run your workflow, you’ll see that you now have two new columns to your data. “DistanceMiles” is the distance, in your selected unit of measure, between the plant location and the customer location. The “Direction” is the direction that would be traveled between those two locations.
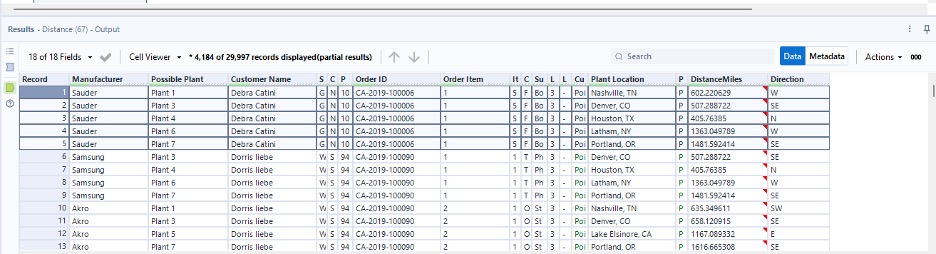
As you can see from the above, we still have multiple plants assigned to a single order. Now that we’ve identified which plants could potentially fulfil the order and we’ve identified the distance between each plant and the customer location, we can now determine the plant with the shortest distance and assign it as the final shipping plant.
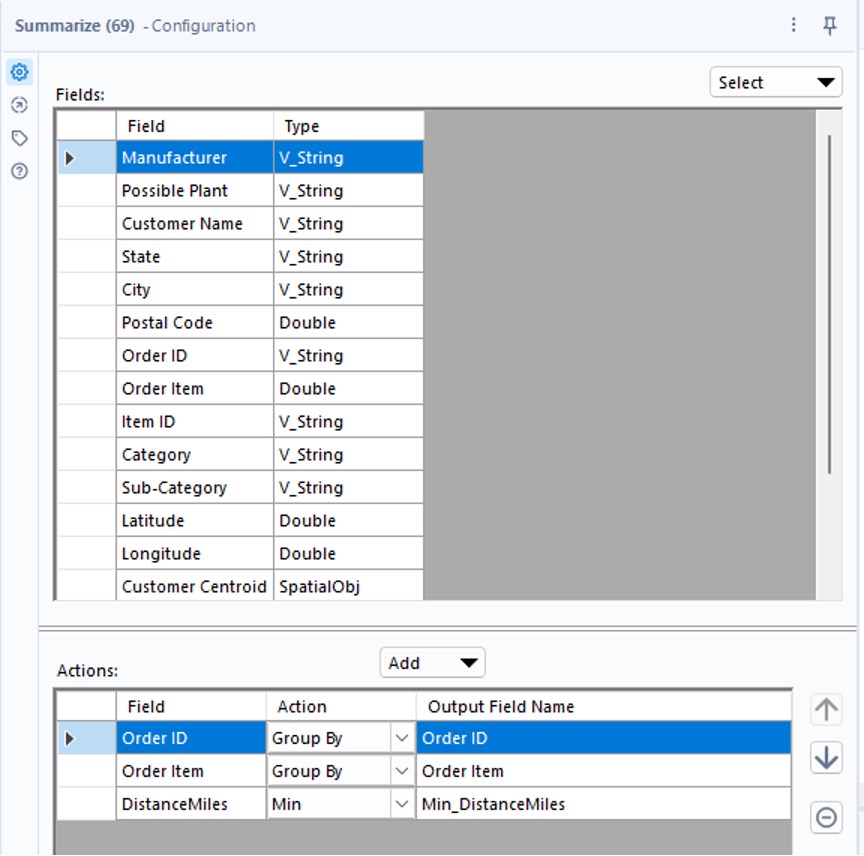
To do this, we’ll add a summarize tool to our distance tool output anchor. We’ll configure it to group by the order ID and order item fields and aggregate the data to the minimum distance.
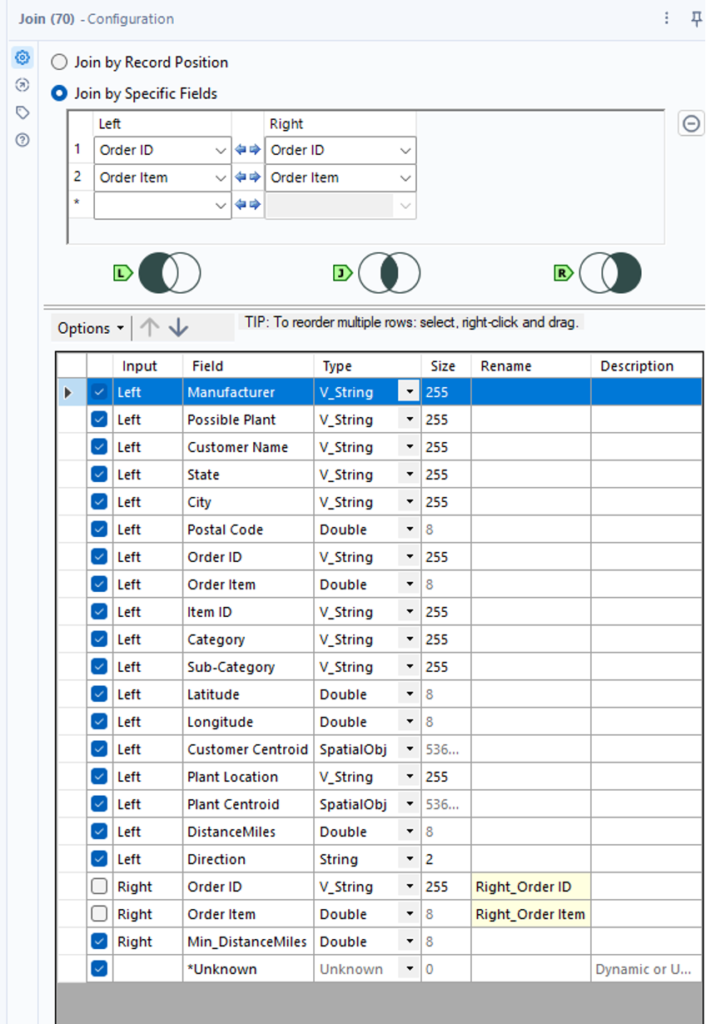
We’ll join these results back to our original data source by adding a join tool to our canvas. We’ll connect the distance tool output anchor to the left join input anchor and the summarize tool output anchor to the right join input anchor. We will join on order ID and order item and configure the embedded select tool to include the new “Min_DistanceMiles” field.
From here, we’ll add a filter tool to the canvas. We’ll configure the filter tool to only include records where the DistanceMiles field equals the Min_DistanceMiles field. This will exclude all other plant options from our data. I’ve also added a select tool to only include the columns we need. You can now see that for each order ID and order line item, we’ve assigned a single “Final Plant” location.
While spatial analytics is a step beyond standard data prep and output, it can be a vital tool to better understand and find valuable insights in geographic data. Alteryx is a powerful tool that can provide efficiency and scalability. I enjoy helping clients recognize value by finding better ways to automate their business data processes, then using the time savings to identify business value and insights in their data. To learn more about how I and Lovelytics help clients do more with their data, please visit us at https://lovelytics.com/or connect with us by email at [email protected].